NCERT Solutions for Class 7 Maths Chapter 3 Exercise 3.3 Data Handling in Hindi and English Medium prepared for academic session 2025-26. All the question answers and solution are revised and modified on the basis of new syllabus and latest NCERT textbooks issued for 2025-26 exams.
NCERT Class 7 Maths Exercise 3.3 Solution in Hindi and English Medium
| Class: 7 | Mathematics |
| Chapter: 3 | Exercise: 3.3 |
| Topic Name: | Data Handling |
| Content: | NCERT Textbook Solutions |
| Session: | 2025-26 |
| Medium: | English and Hindi Medium |
Class 7 Maths Chapter 3 Exercise 3.3 Solution
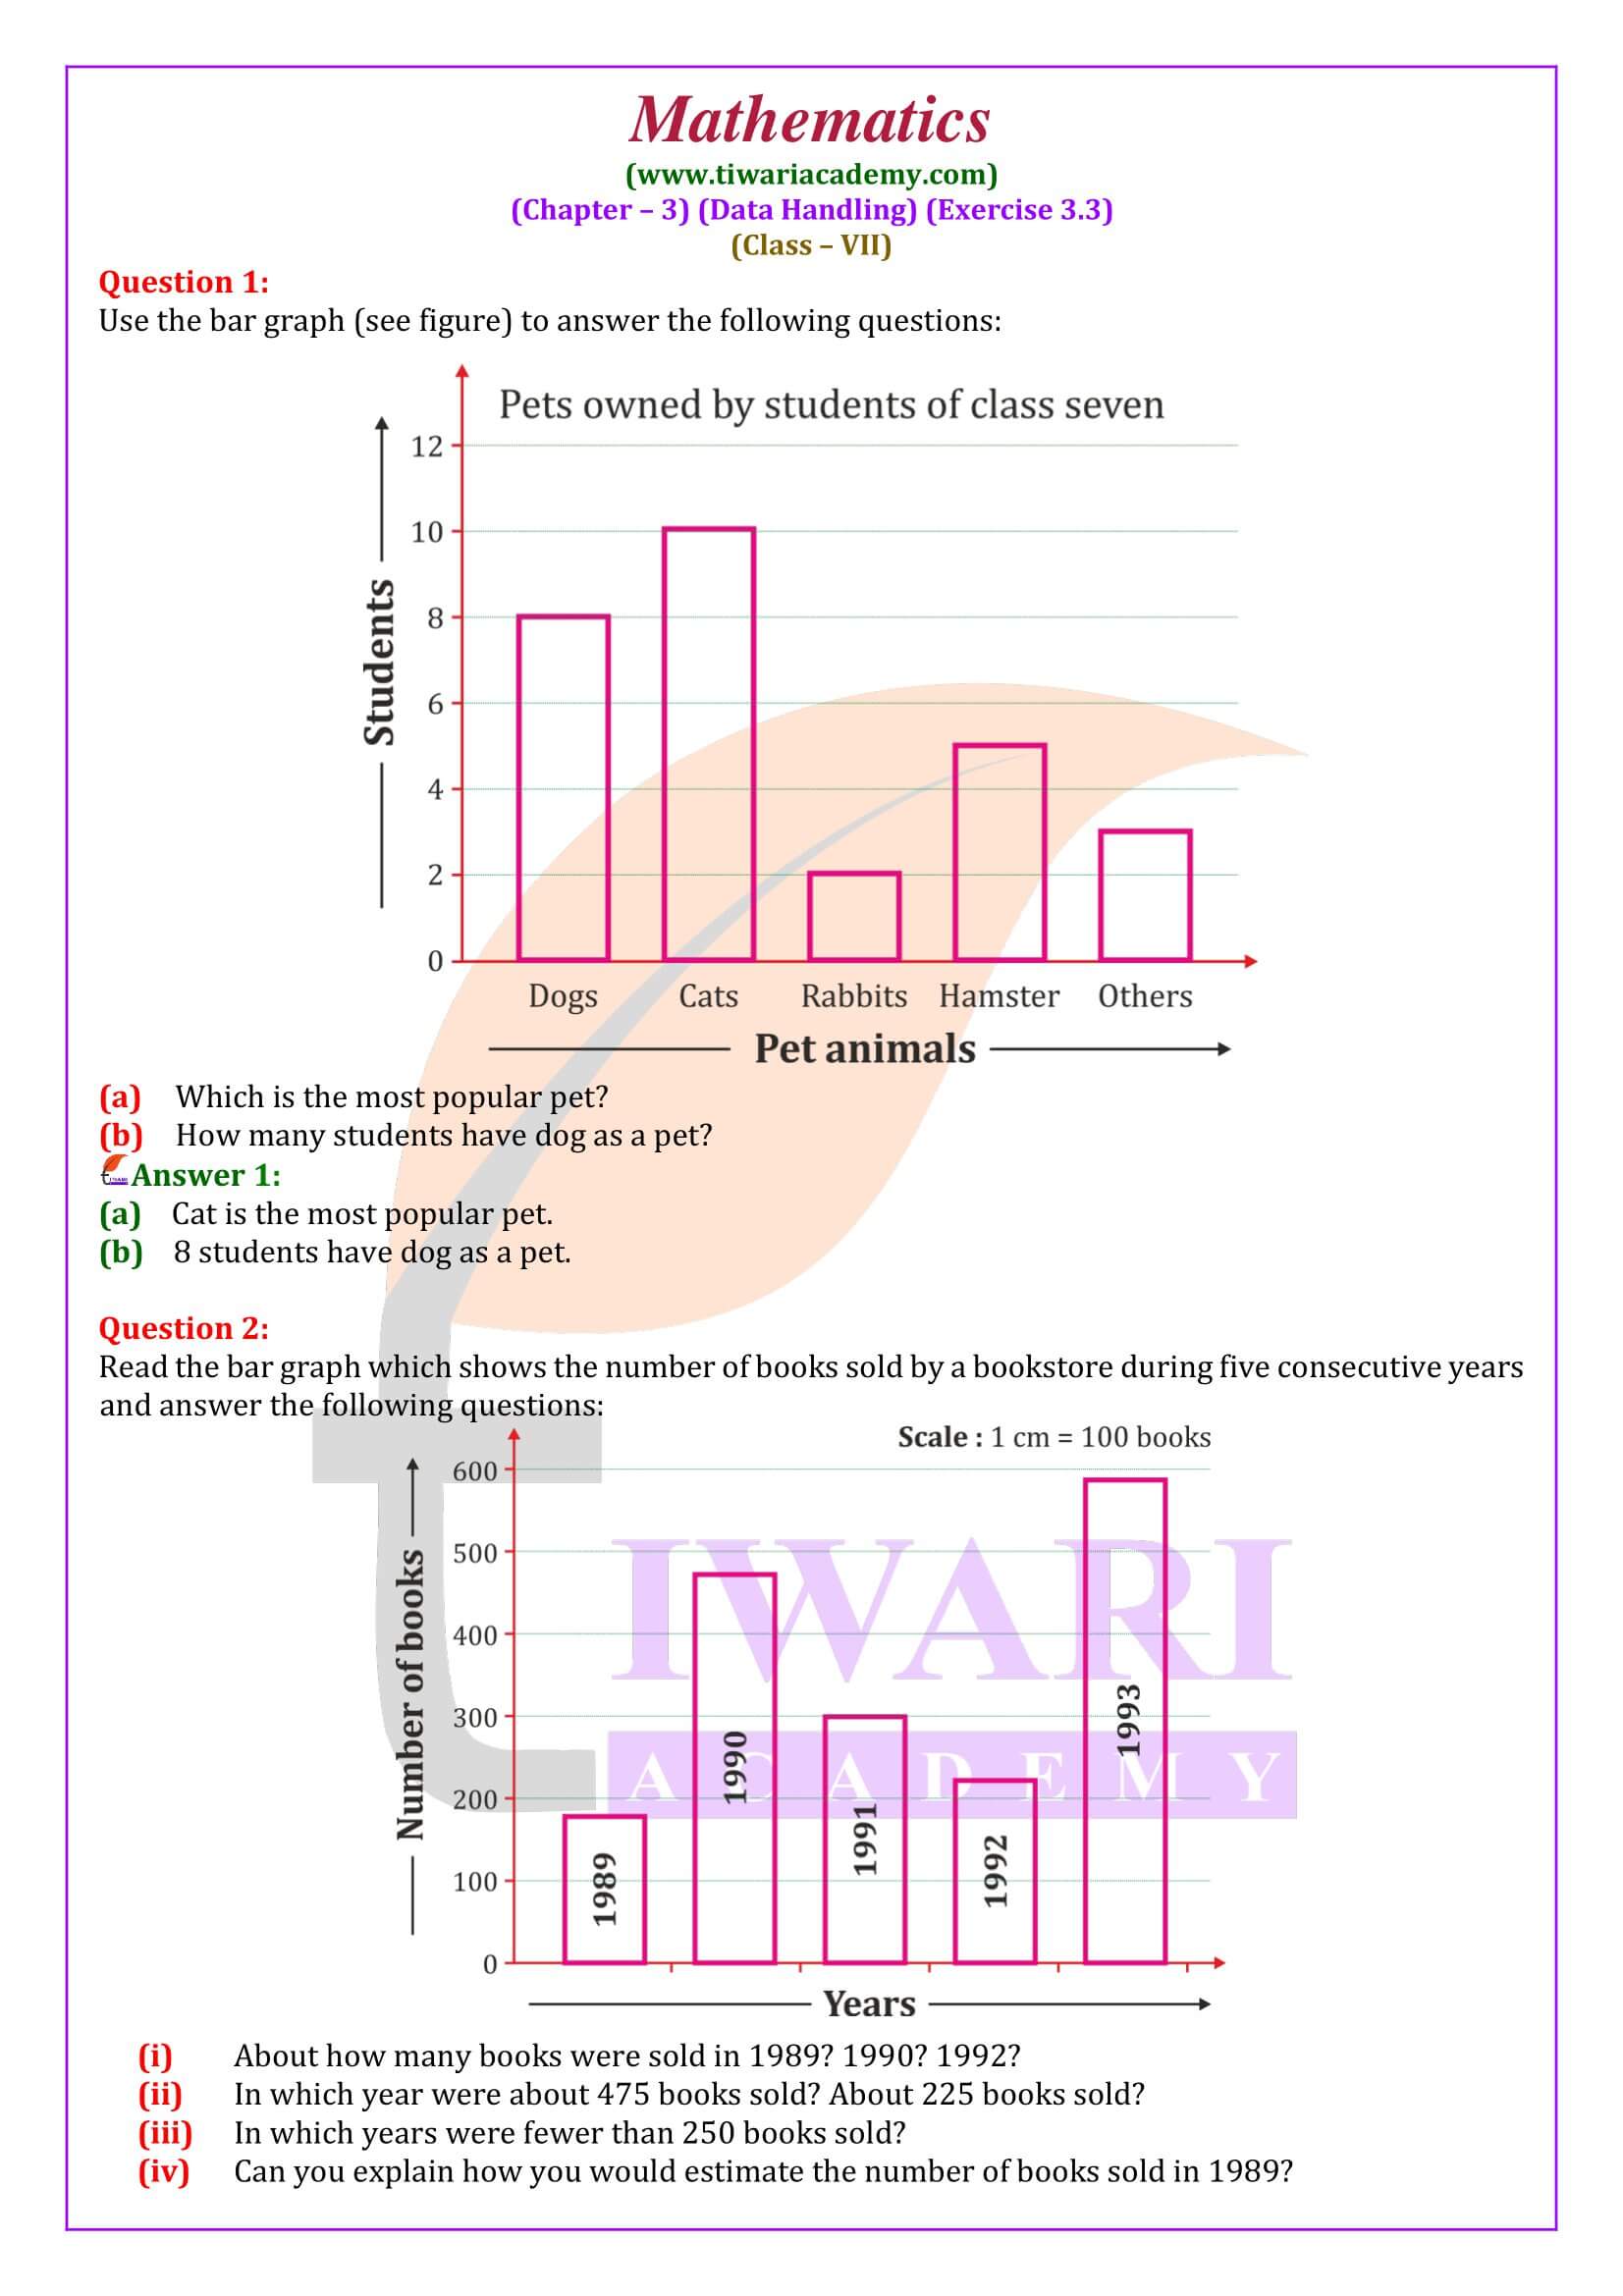
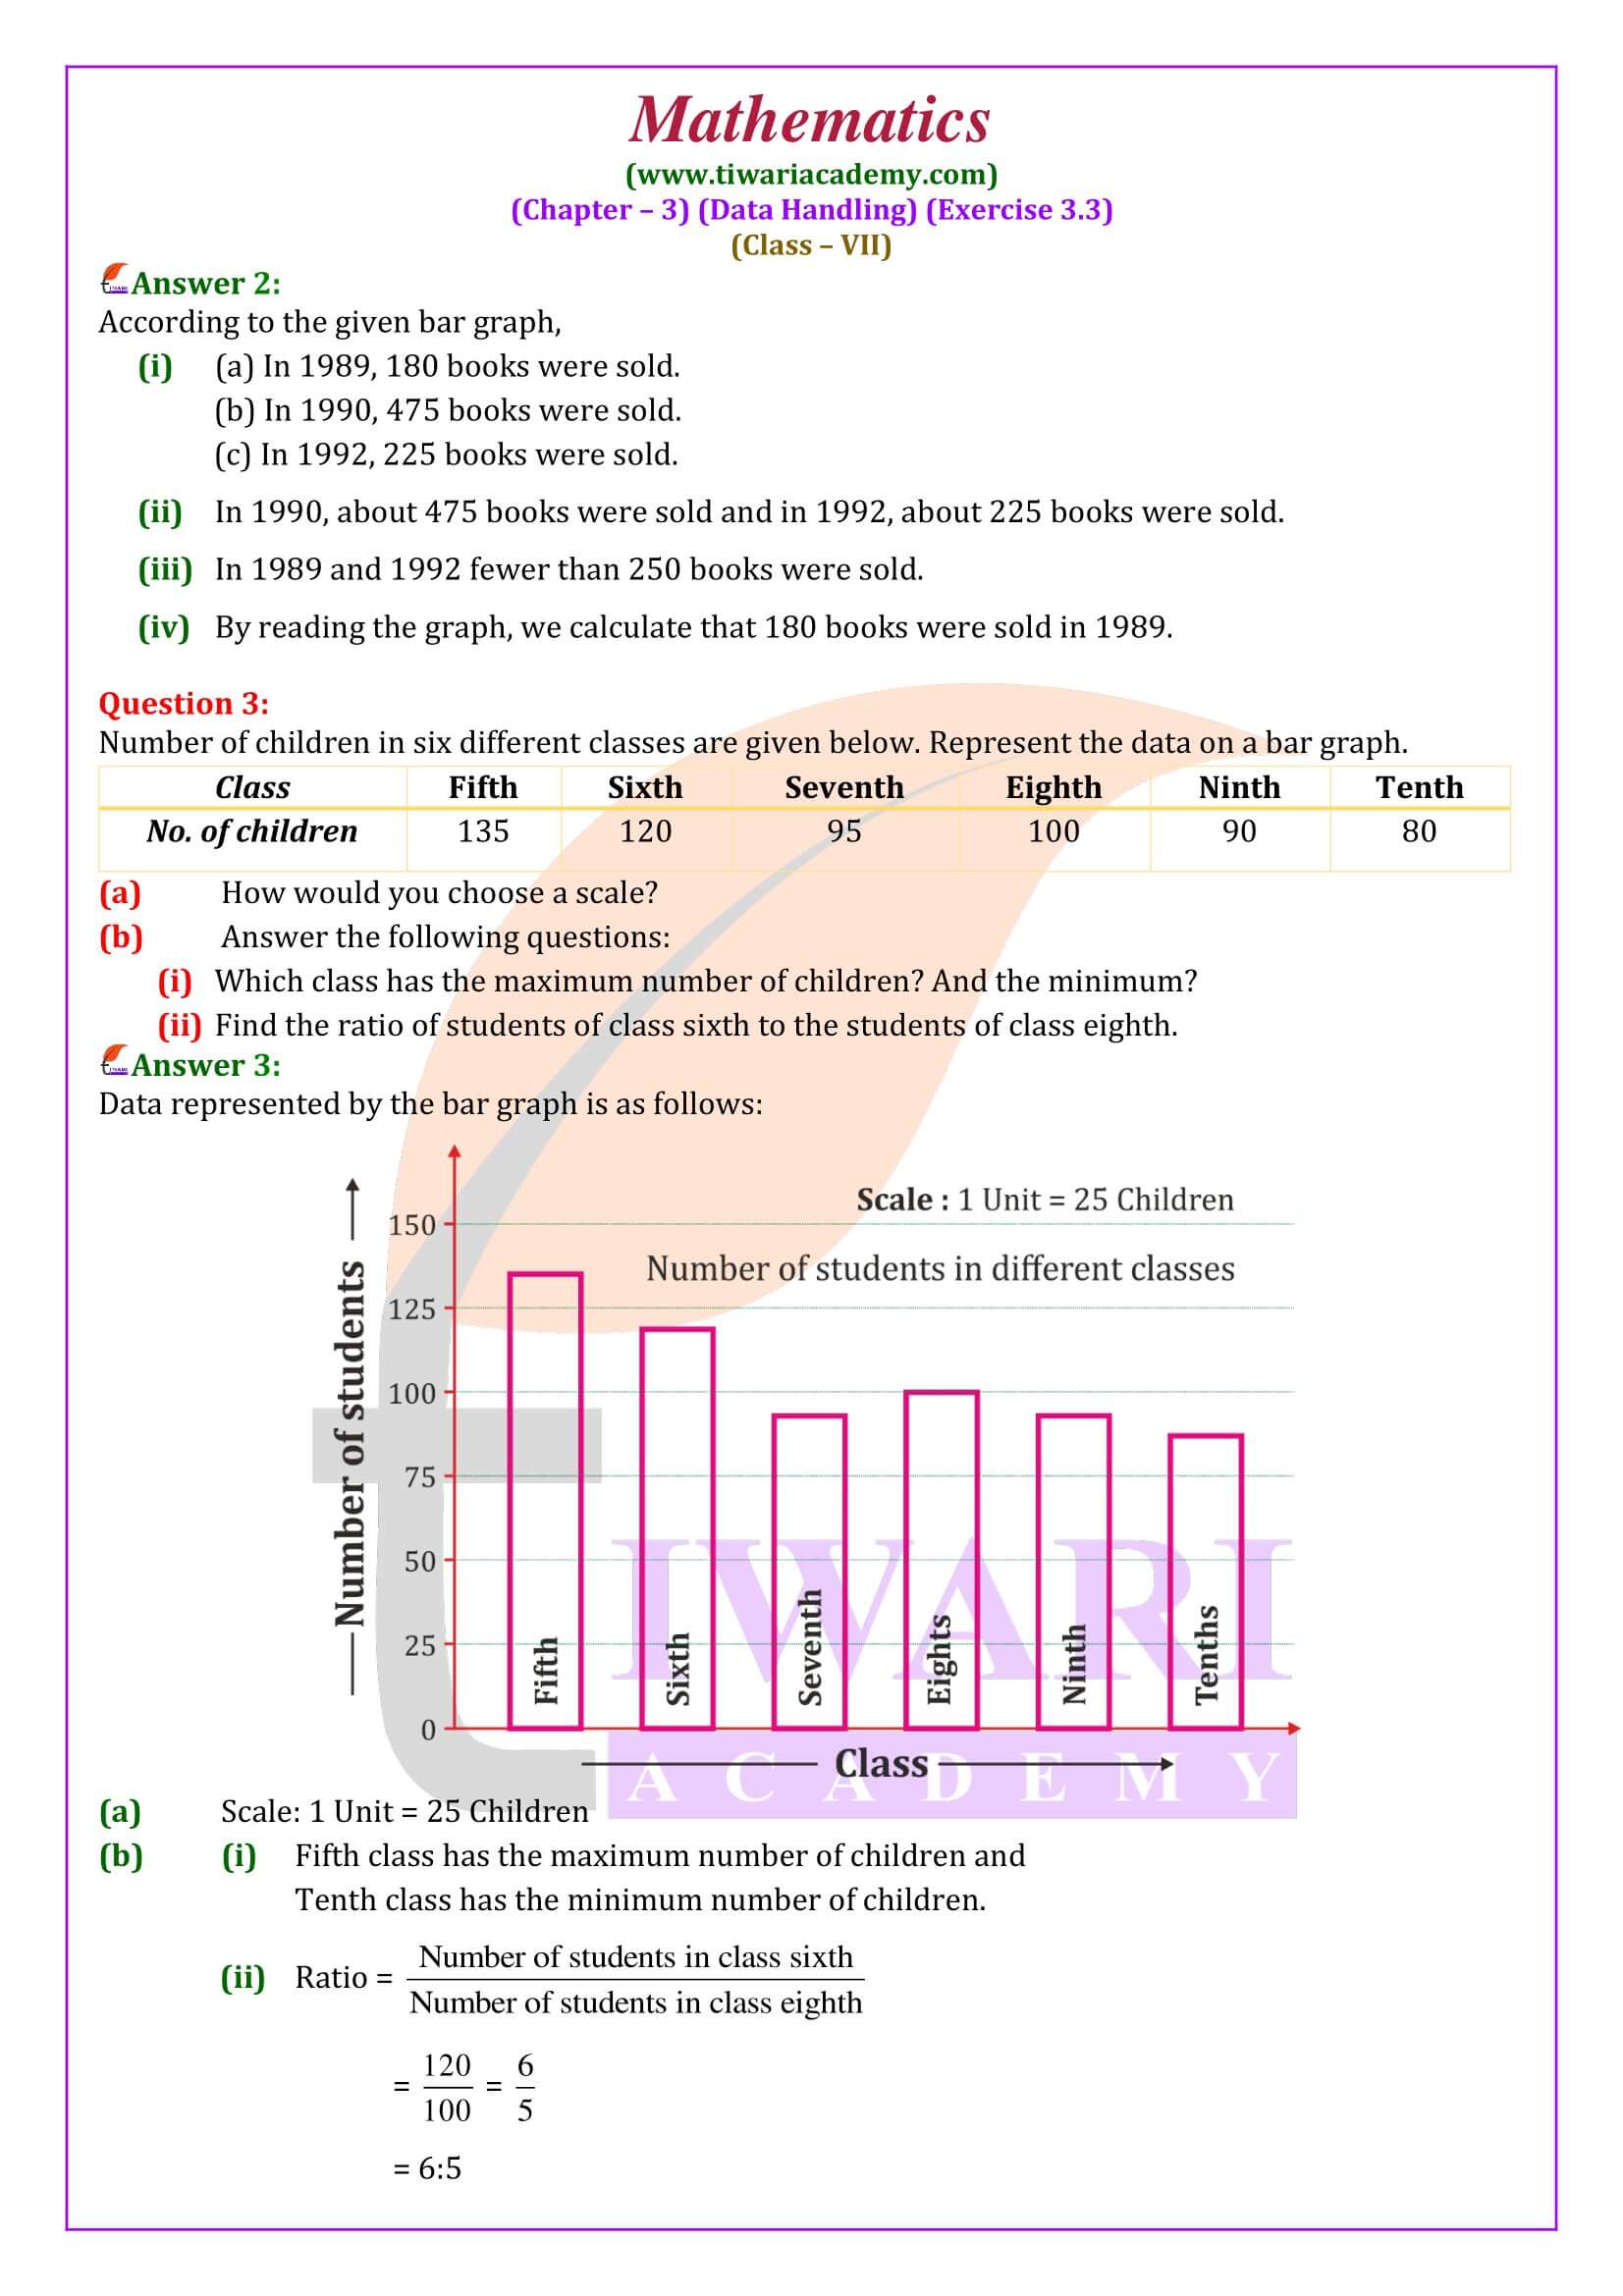
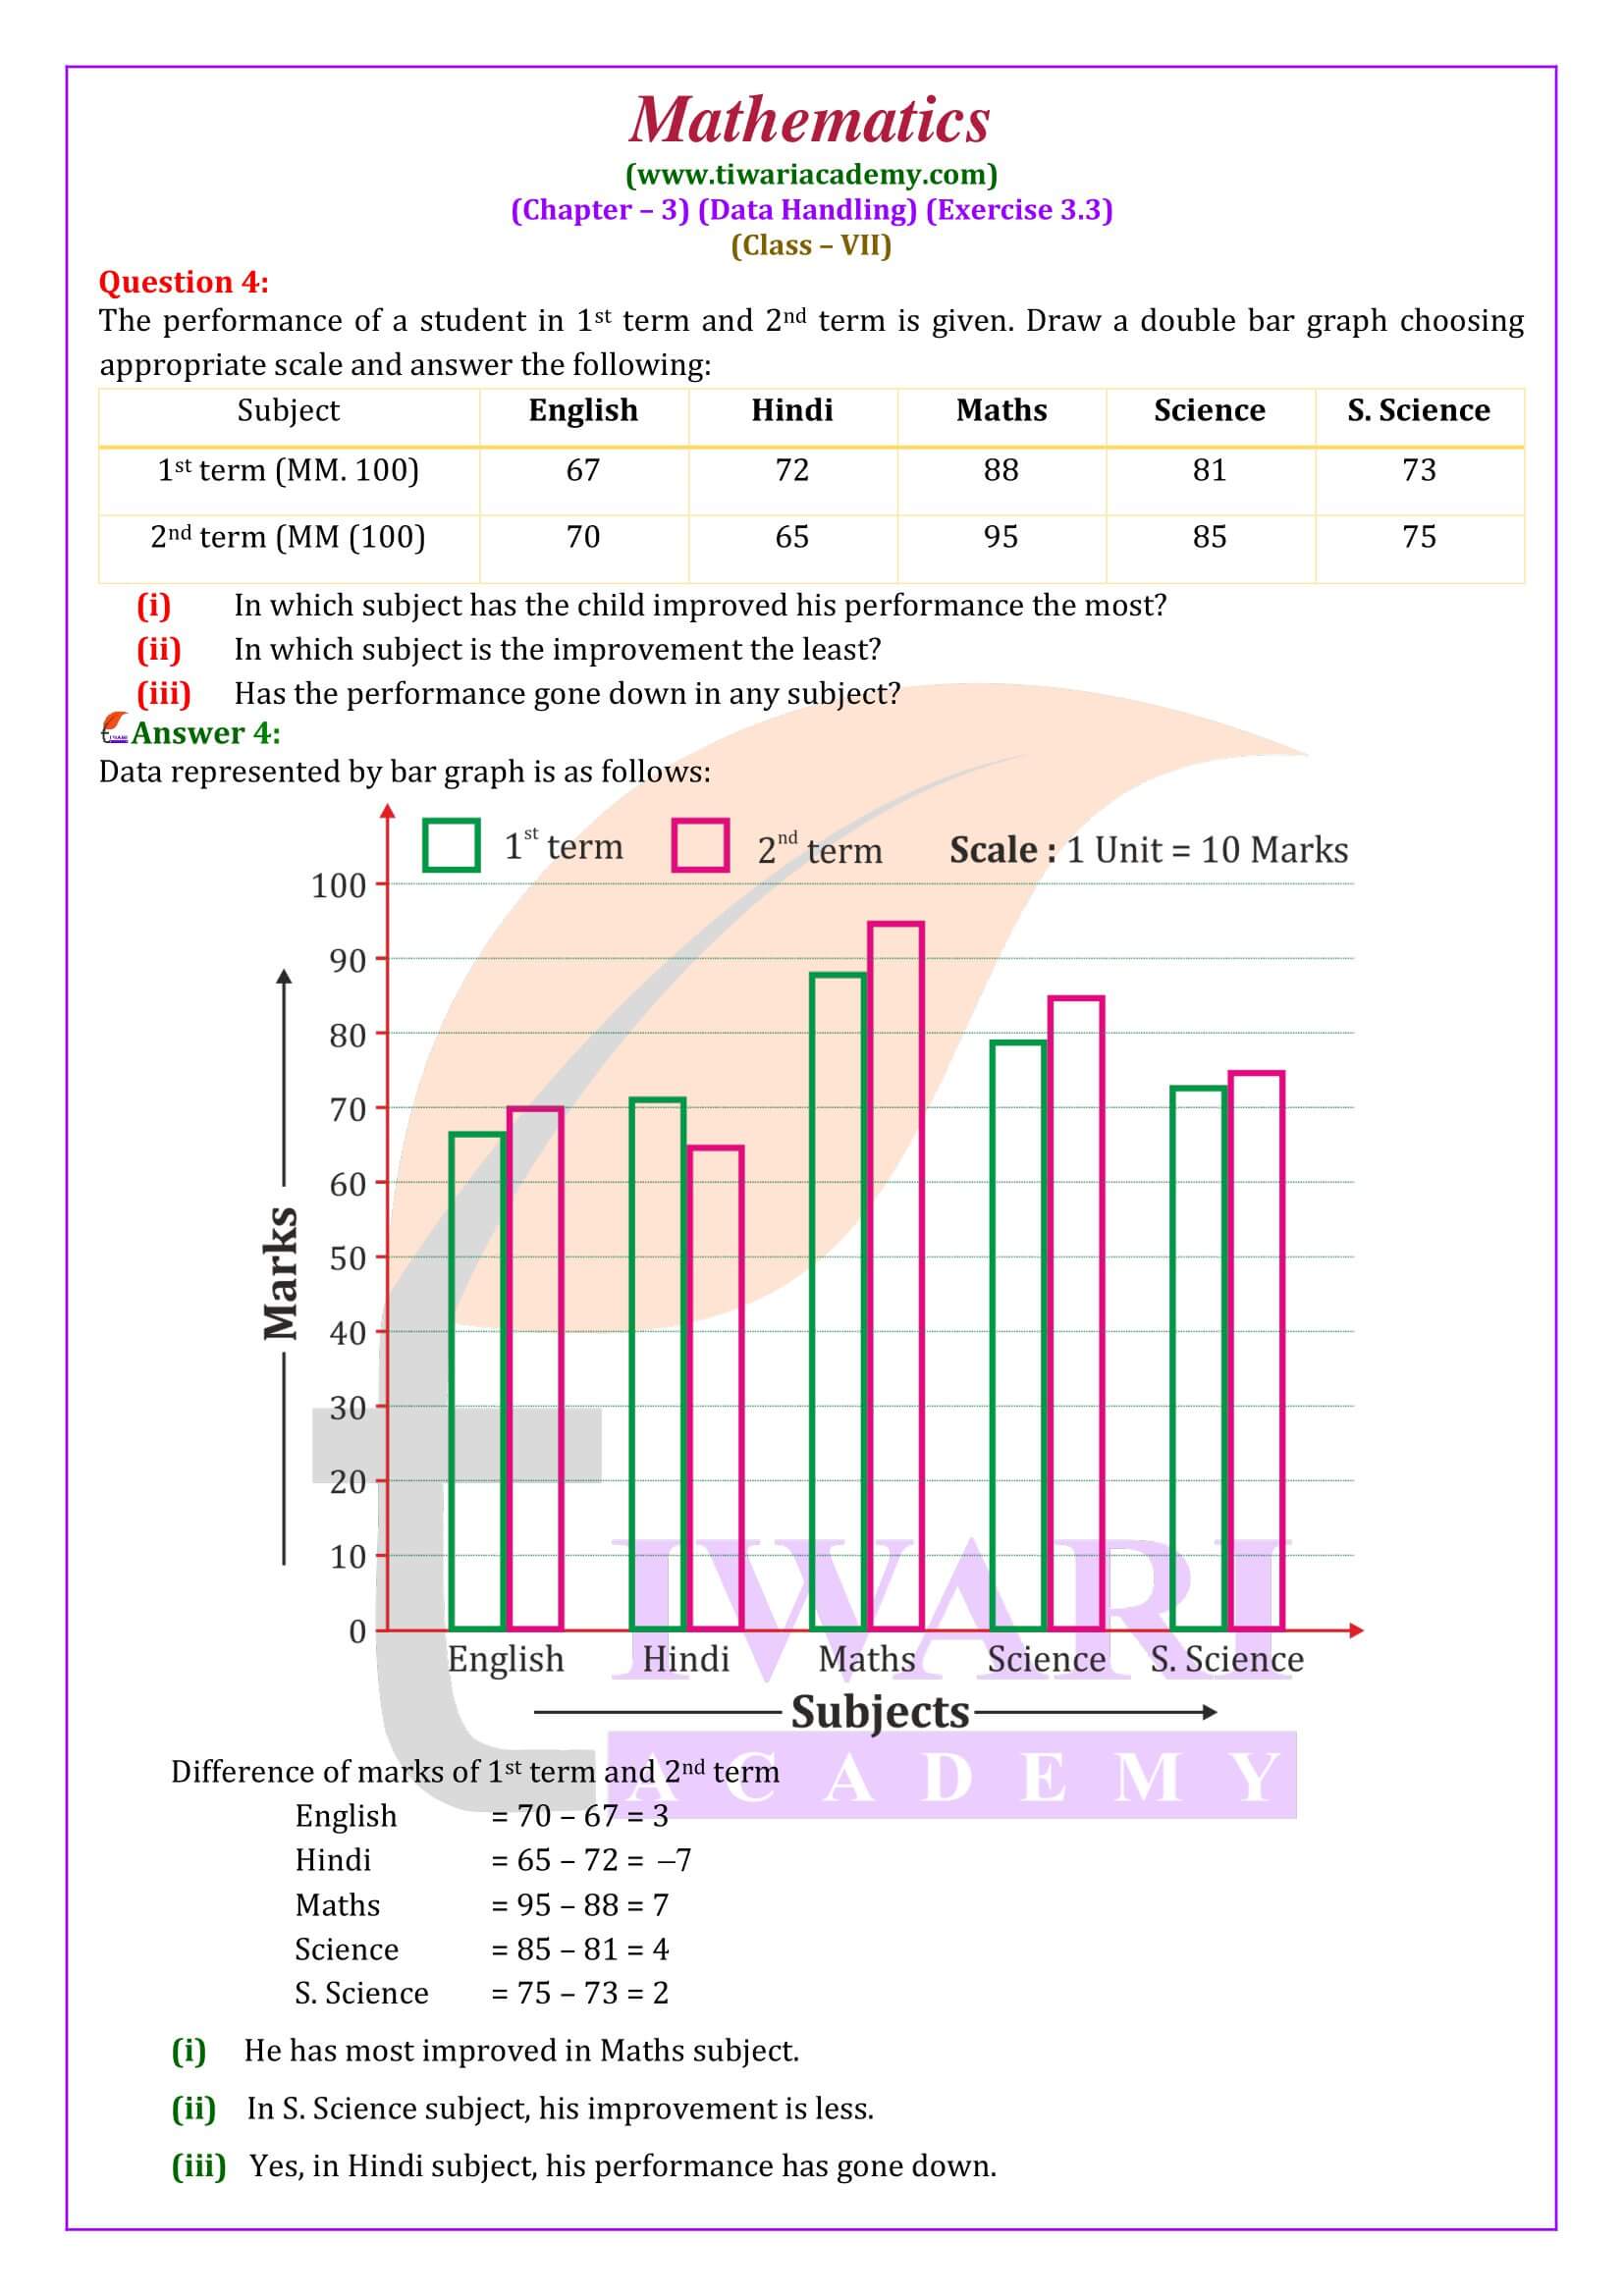
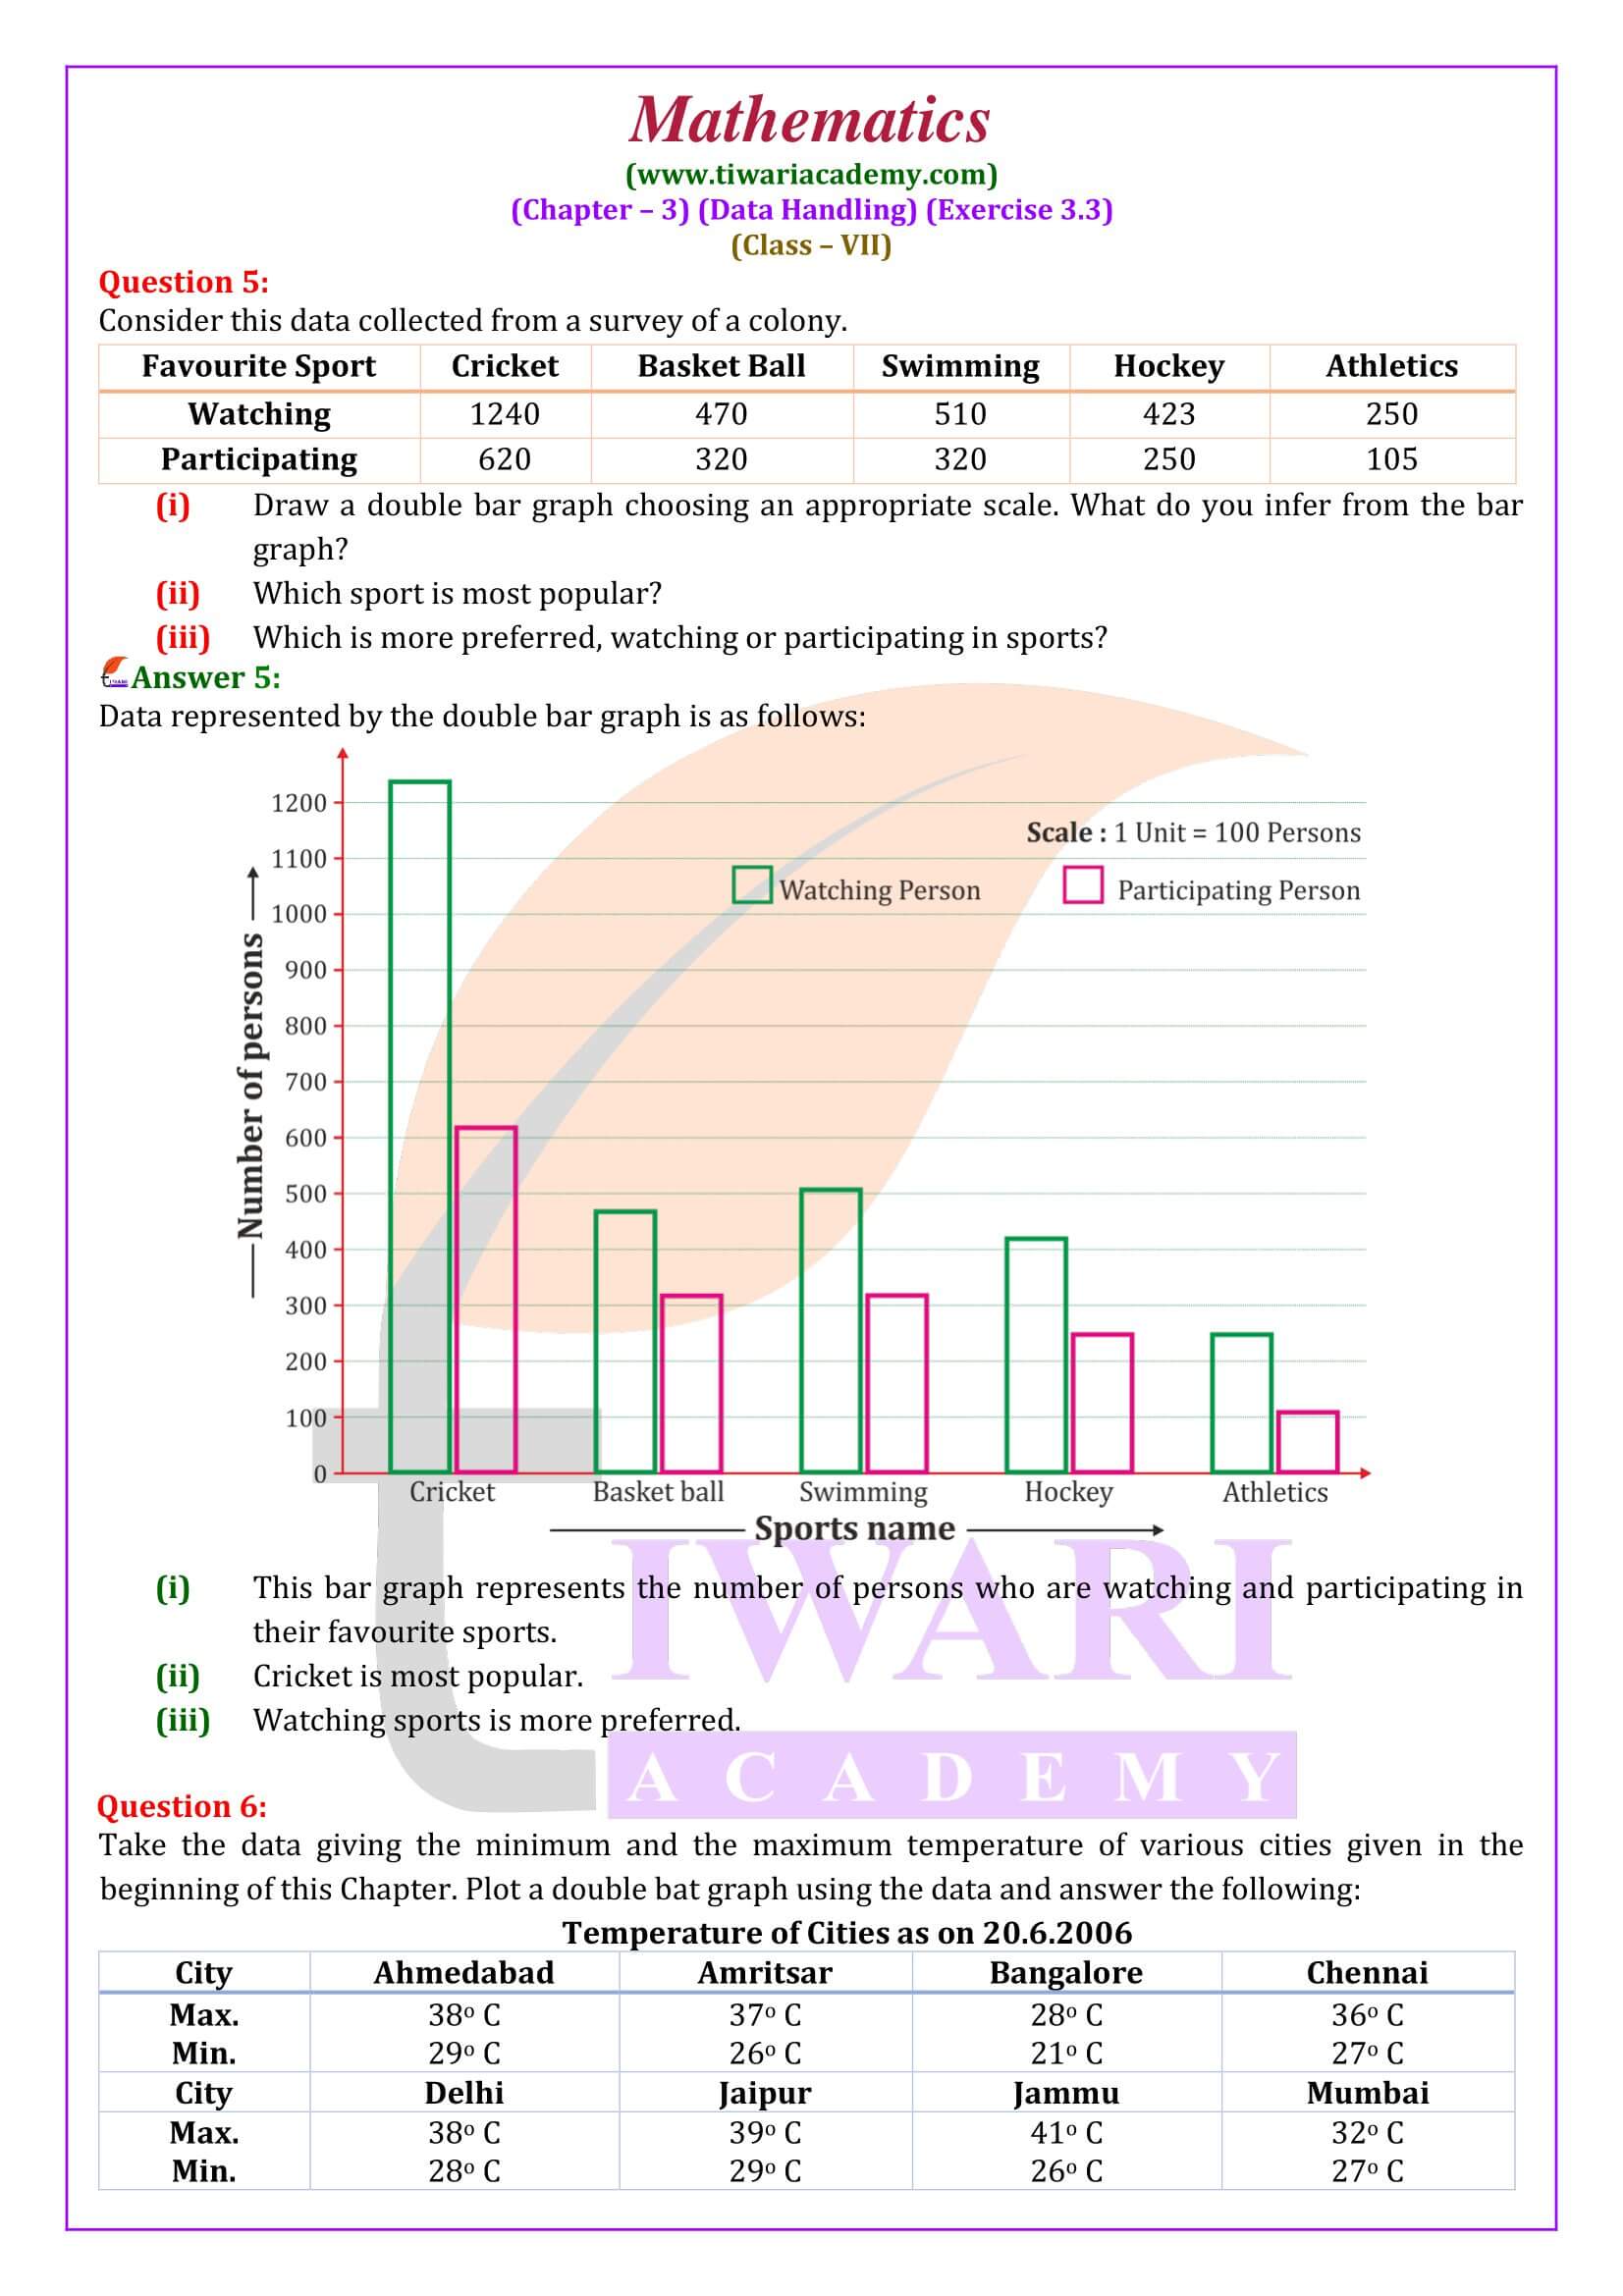
All the contents are updated for academic session 2025-26 CBSE and State board students. In class 7 math exercise 3.3, questions are based on observation of bar graph and plotting of bar graph. It is one of the interesting exercise of class 7 math chapter 3.
Class 7 Maths Chapter 3 Exercise 3.3 Solution in Videos
Mode of Ungrouped Data
Mode is the value of the variable which occurs most frequently.
Given below is the number of pairs of shoes of different sizes sold in a day by the owner of a shop.
Size of shoe: 1, 2, 3, 4, 5, 6, 7, 8, 9
Number of pairs sold: 1, 2, 2, 3, 4, 5, 3, 7, 2
What is the modal shoe-size?
Since the sale of size 8 is maximum, so the model shoe-size is 8.
Class 7 Maths Exercise 3.3 Important Questions
What information does the bar graph give?
Bar graphs are ideal for comparing two or more values, or values over time. Data is displayed either horizontally or vertically. Single bar graphs are used to convey discrete values of an item within a category. For instance, a bar graph could display the number of males with a certain trait for specific ages.
How are bar graphs useful in real life?
People can also use bar graphs and pie charts for personal reasons, such as keeping track of finances. Being able to read and analyze these graphs is a good skill to have because these graphs and charts are seen all the time in the real world. Sometimes, they are even shown in commercials.
How do you describe a stacked bar graph?
A stacked bar graph (or stacked bar chart) is a chart that uses bars to show comparisons between categories of data, but with ability to break down and compare parts of a whole. Each bar in the chart represents a whole, and segments in the bar represent different parts or categories of that whole.
Empirical Formula for Calculating Mode
We use the formula: Mode = 3 (Median) – 2 (Mean) or Mode = 2 Md – 2 Mean.
Bar Graph
A bar graph is a pictorial representation of numerical data in the form of rectangles (or bars) of equal width and varying heights.
These rectangles are drawn either vertically or horizontally, keeping equal space between them. The height (or length) of a rectangle depends upon the number it represents.
Steps to Draw a Bar Graph
Suppose some numerical data is given to us, and we have to represent it by a bar graph on a graph paper. We can draw the graph by following the steps given below:
Step 1. On a graph paper, draw a horizontal line OX and a vertical line OY. These lines are called the x-axis and the y-axis respectively.
Step 2. Mark points at equal intervals along the x-axis. Below these points write the names of the data items whose values are to be plotted.
Step 3. Choose a suitable scale. On that scale determine the heights of the bars for the given numerical values.
Step 4. Mark off these heights parallel to the y-axis from the points taken in Step 2.
Step 5. On the x-axis, draw bars of equal width for the heights marked in Step 4. The bars should be centred on the points marked on the x-axis. These bars represent the given numerical data.
Which topics will be introduced in exercise 3.3 of class 7th Maths?
In exercise 3.3 of class 7th Maths the following topics will be introduced:
1. Use of bar graphs with a different purpose.
2. Choosing a Scale
3. Drawing double bar graph
Is exercise 3.3 of class 7th Maths lengthy?
Exercise 3.3 of class 7th Maths is not very short and not very lengthy. It lies in the mid of short and lengthy. This exercise has 6 questions and three examples (Examples 8, 9, 10). Students need at least 2 days to finish exercise 3.3 of class 7th Maths if they give at least 1 hour per day to this exercise.
Which questions of exercise 3.3 of class 7th Maths have a chance to come in the exams?
Exercise 3.3 of class 7th Maths has 6 questions and three examples (Examples 8, 9, 10). The problems of exercise 3.3 of class 7th Maths that have a chance to come in the exams are questions 2, 6 and examples 9, 10. These problems are very important. Students can’t skip these problems for the exams.
Is there any need to practice extra questions of exercise 3.3 of grade 7th Maths?
No, there is no need to practice extra questions of exercise 3.3 of grade 7th Maths. Sums of NCERT are sufficient. If students want to practice extra questions of exercise 3.3 of grade 7th Maths then, they can refer to any extra book of class 7th Maths.
