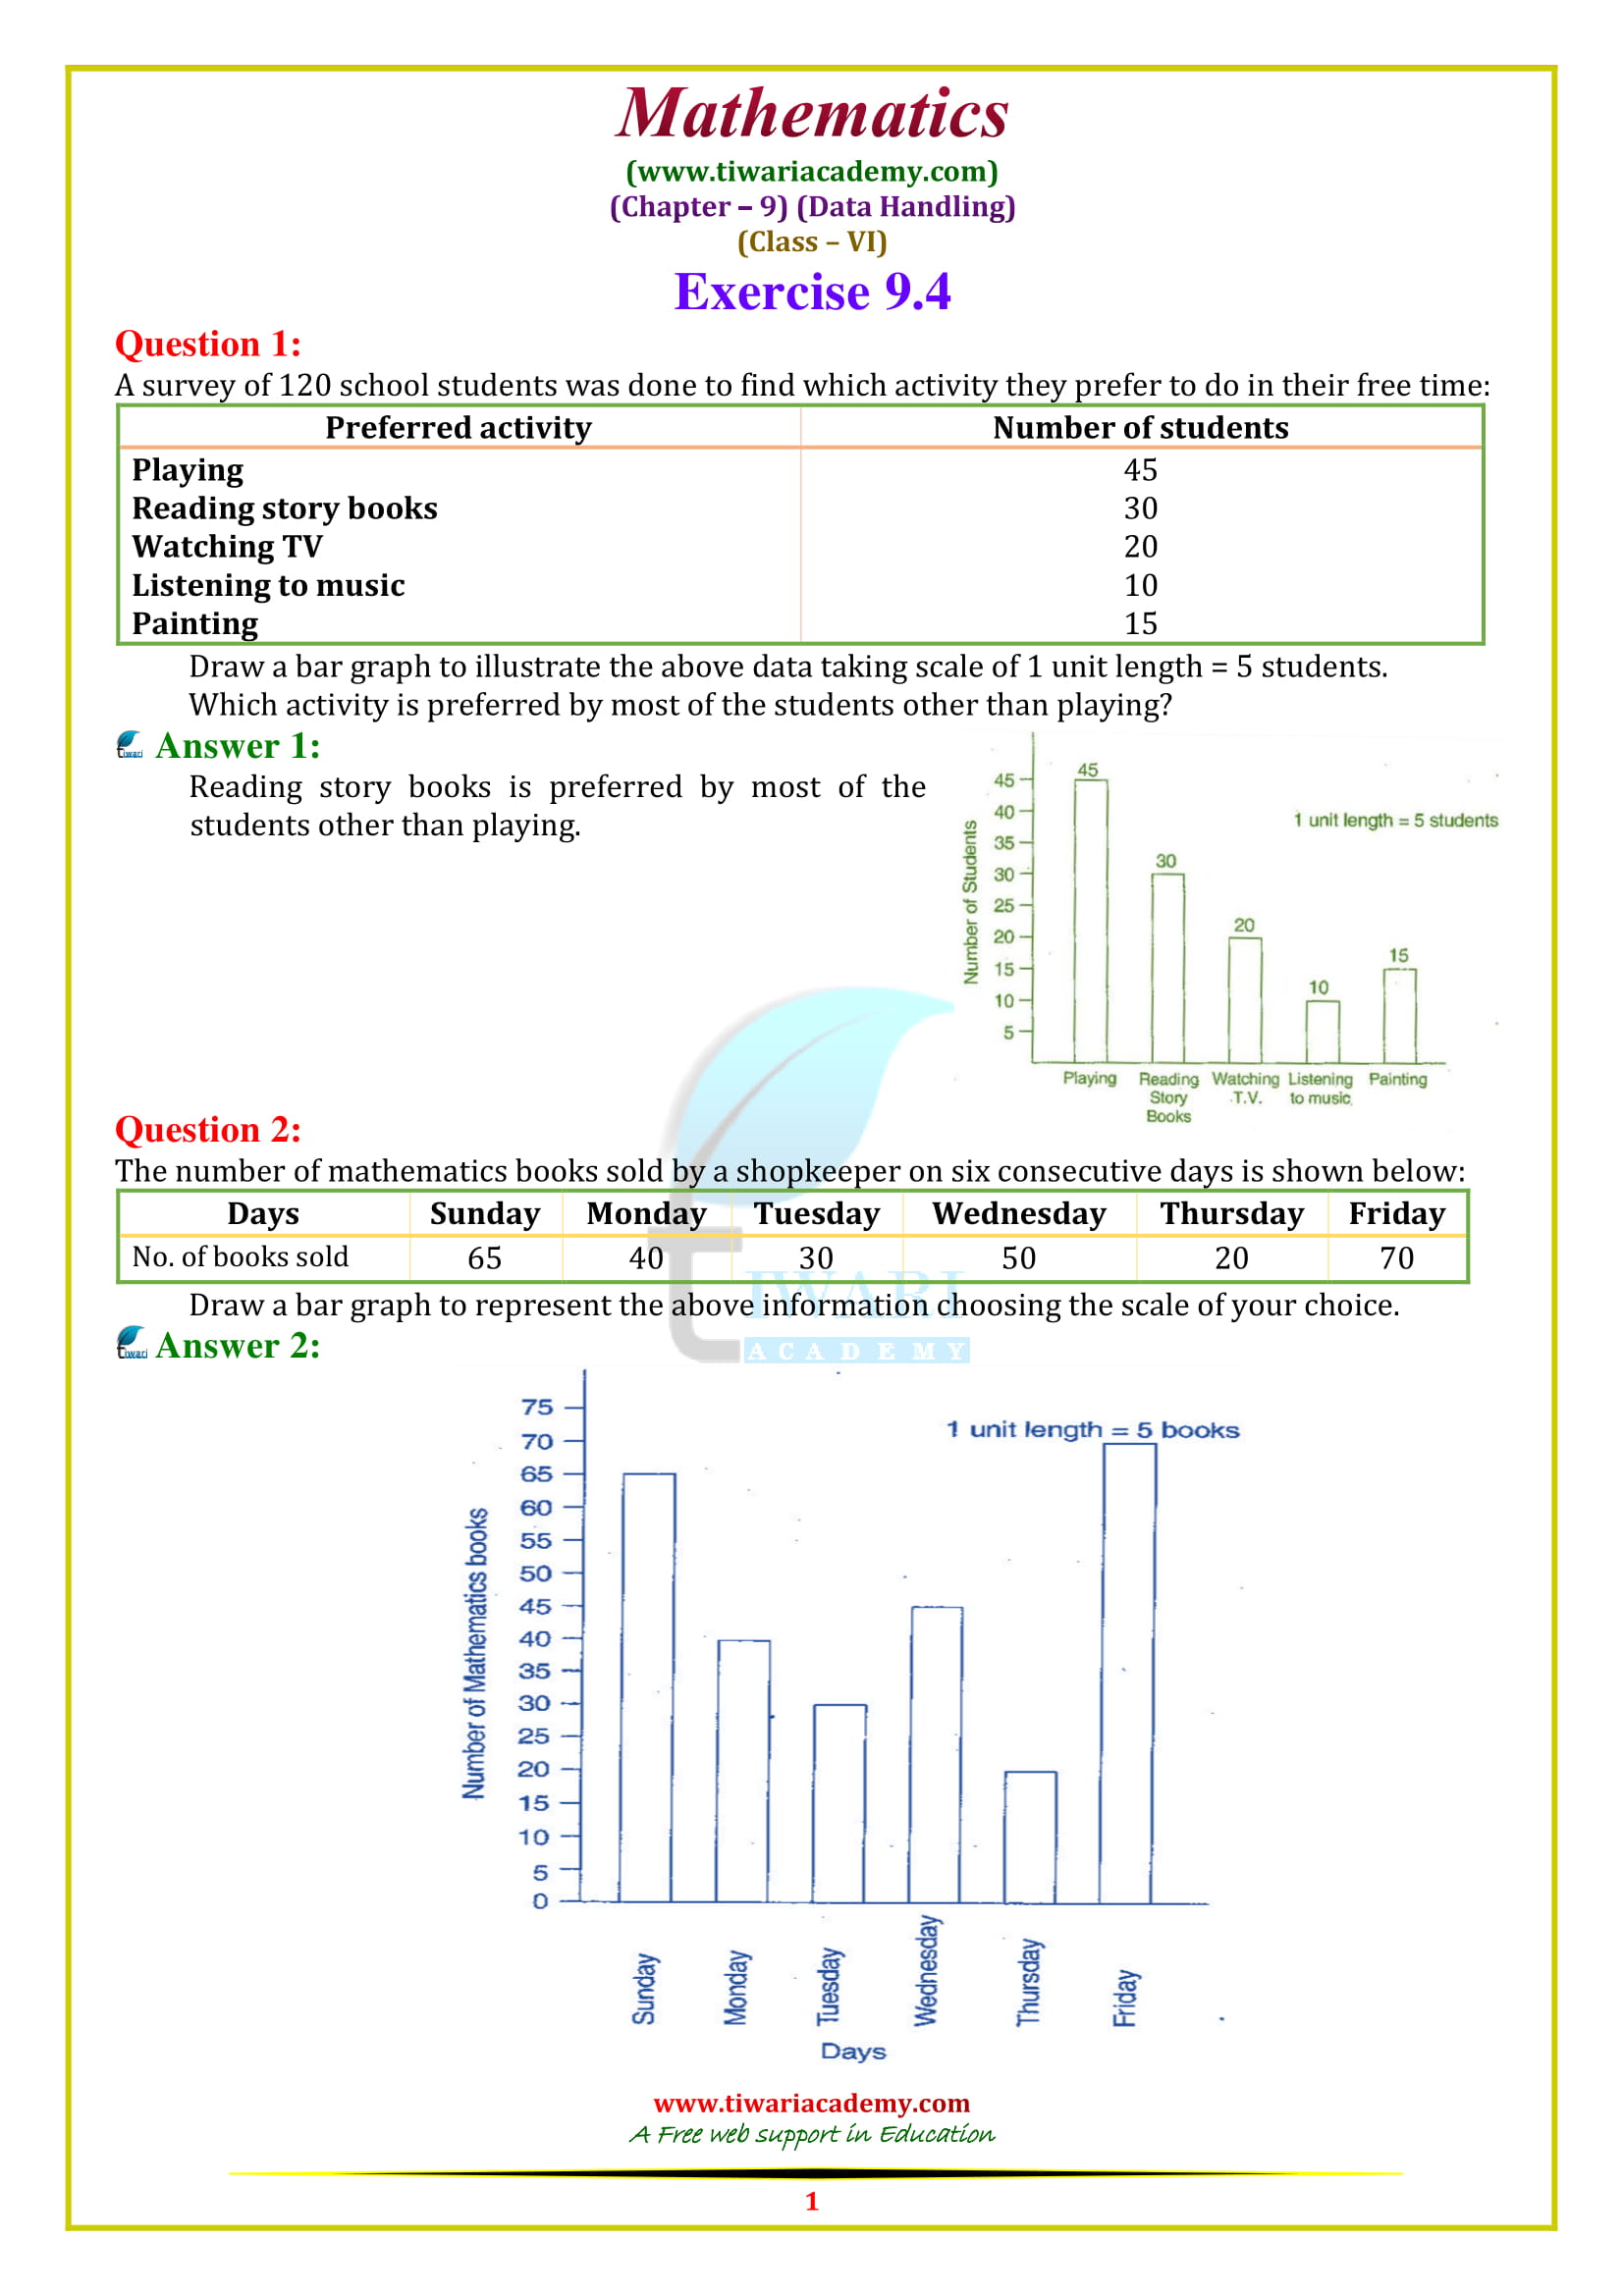
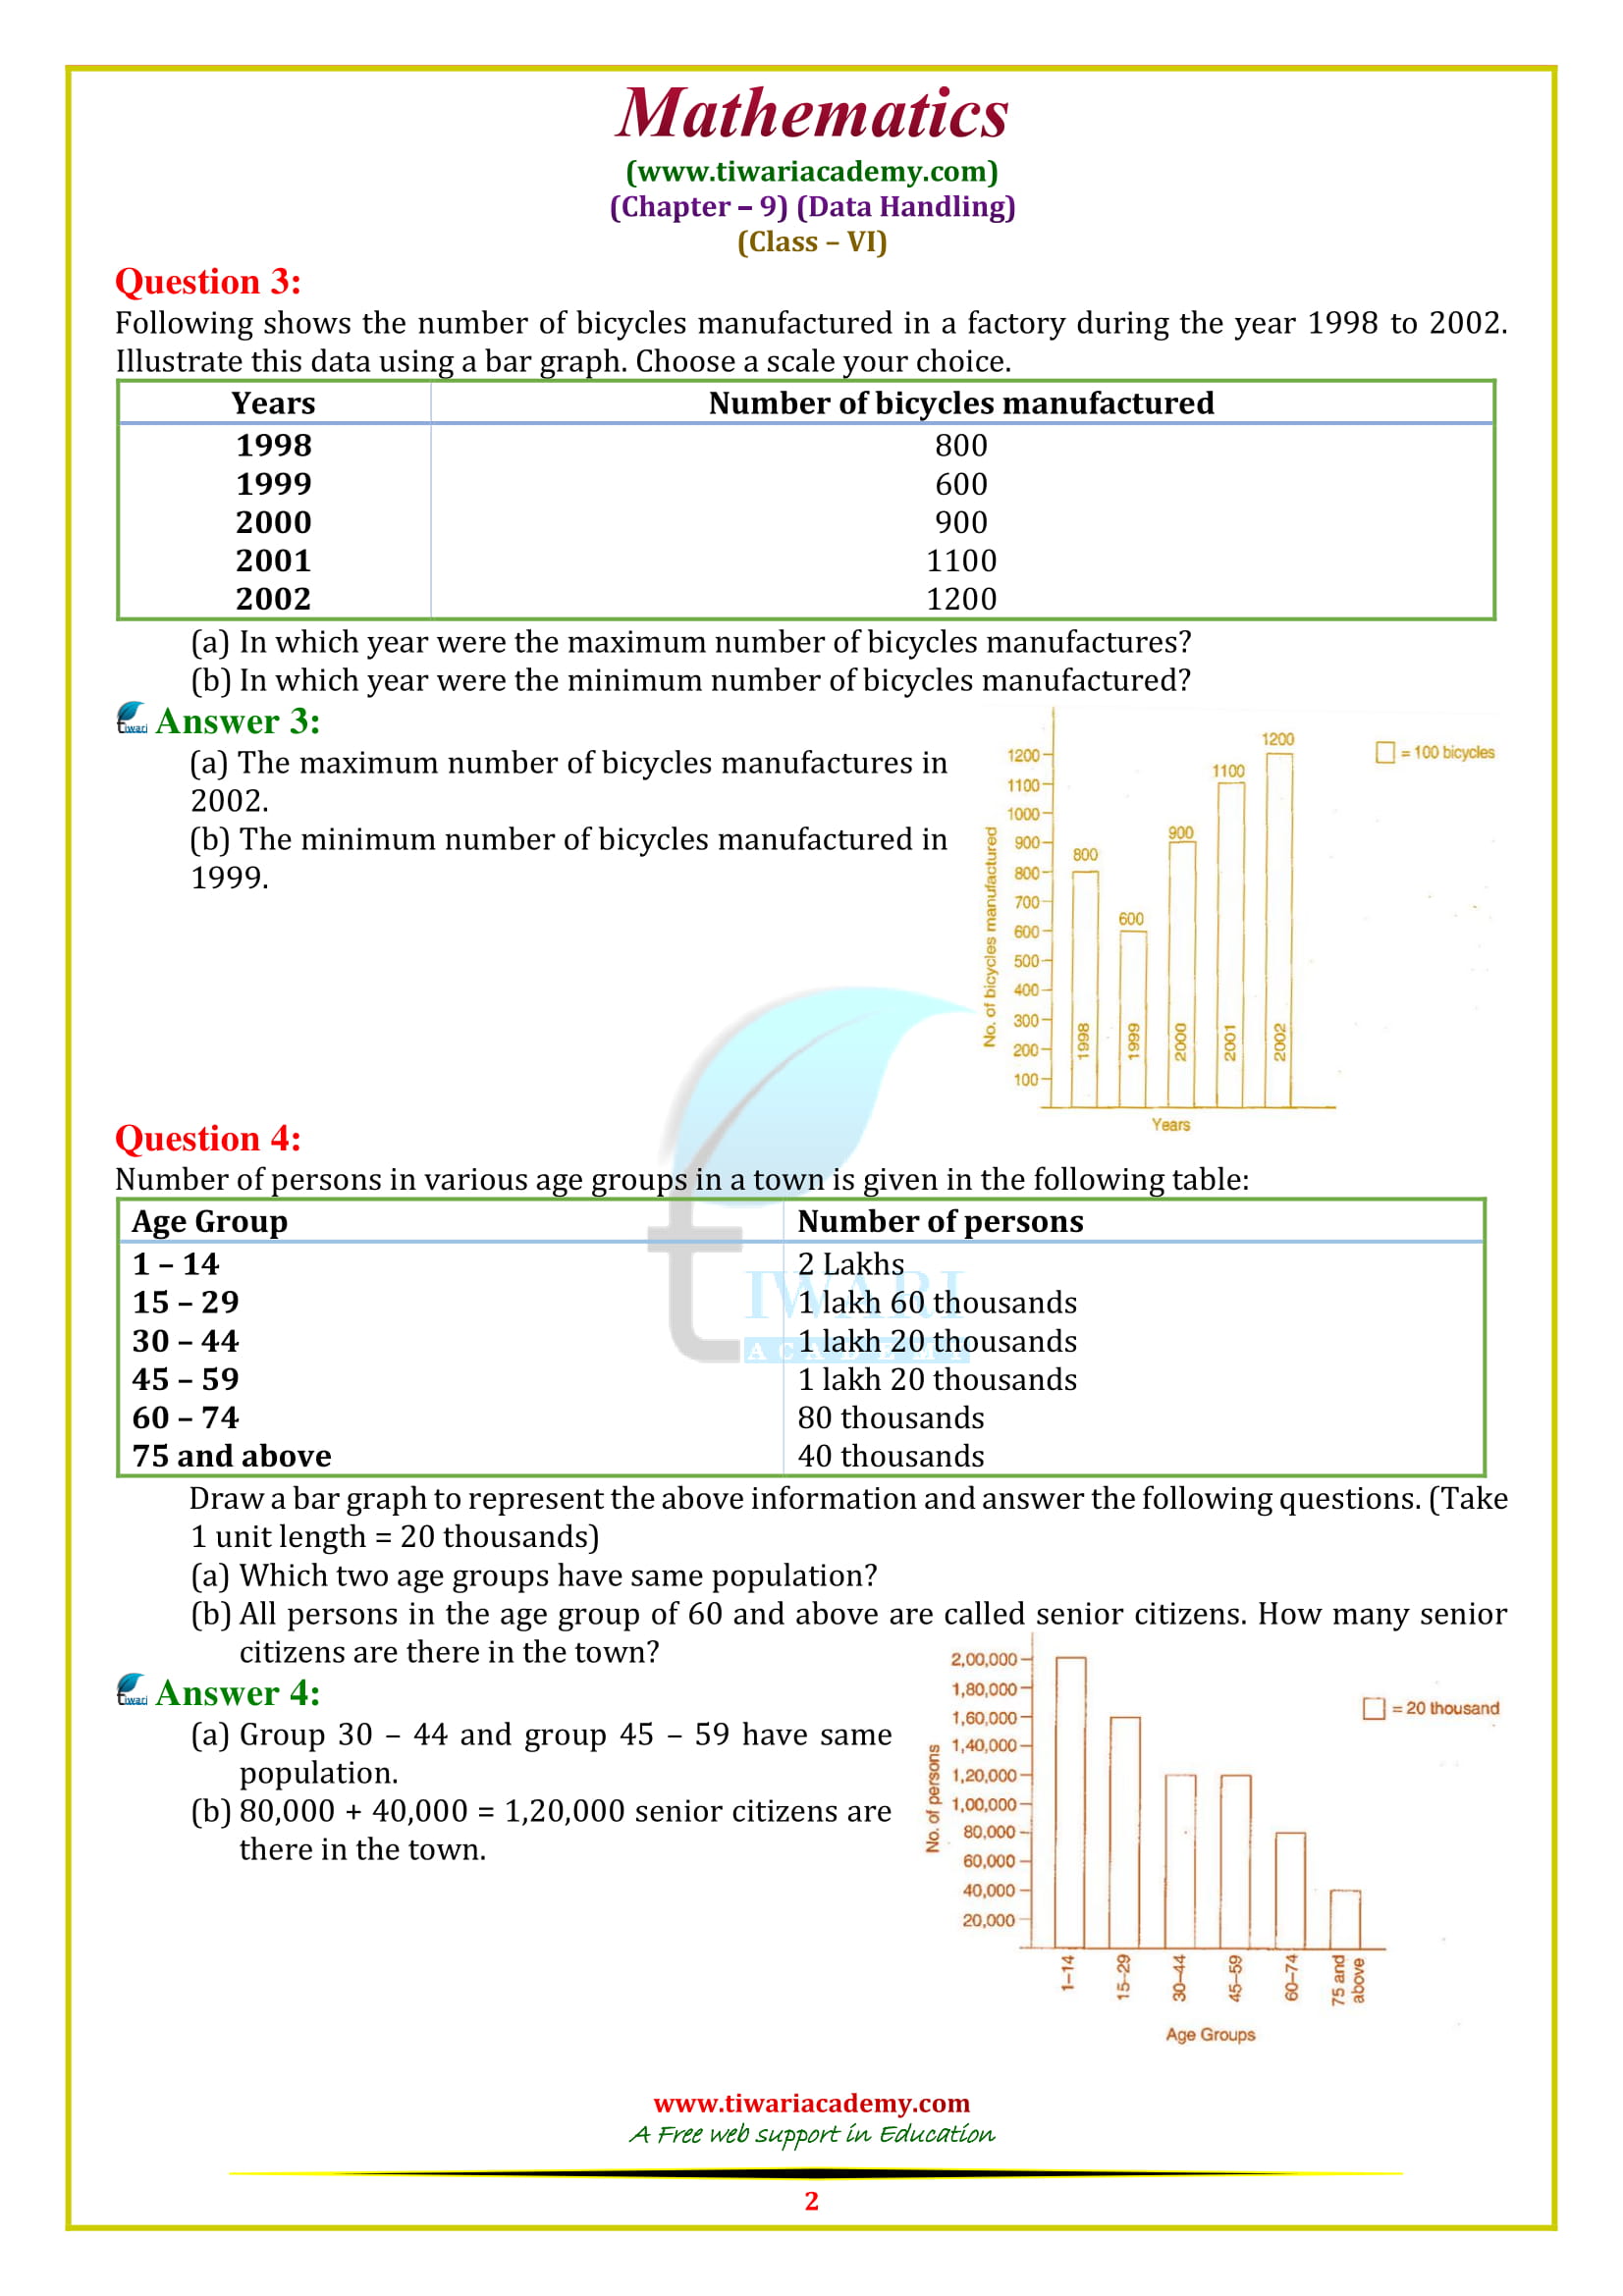
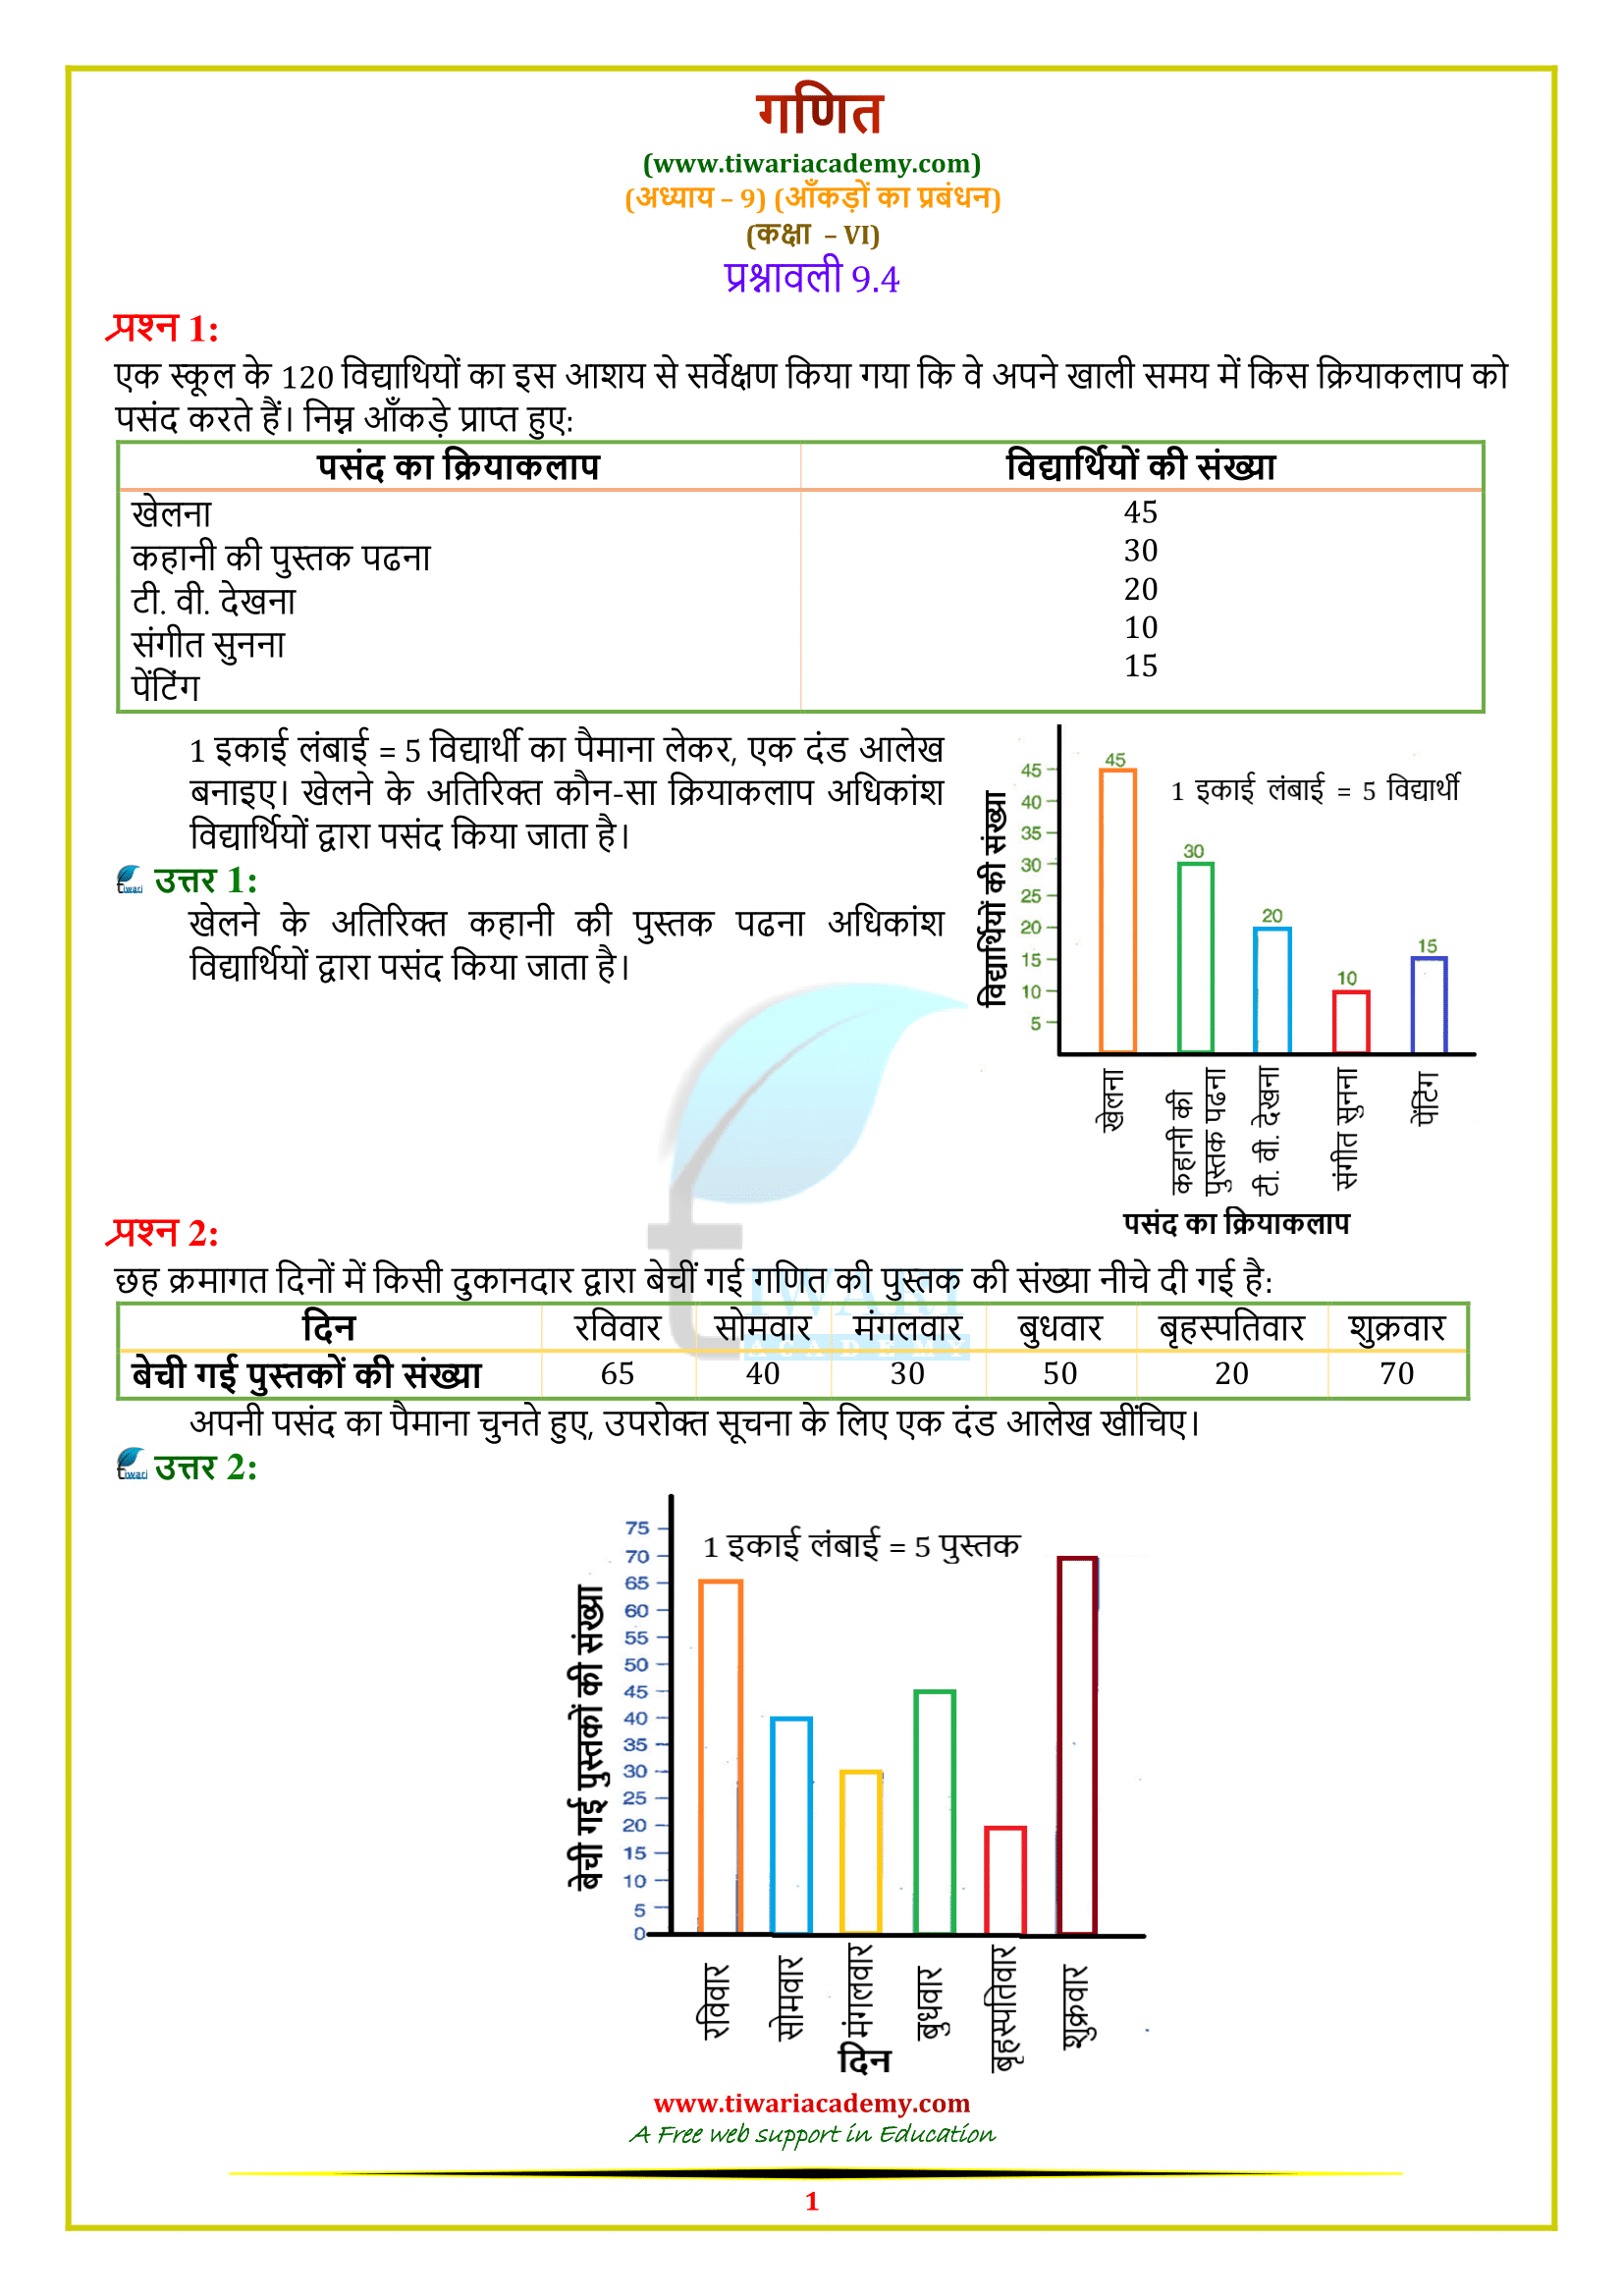
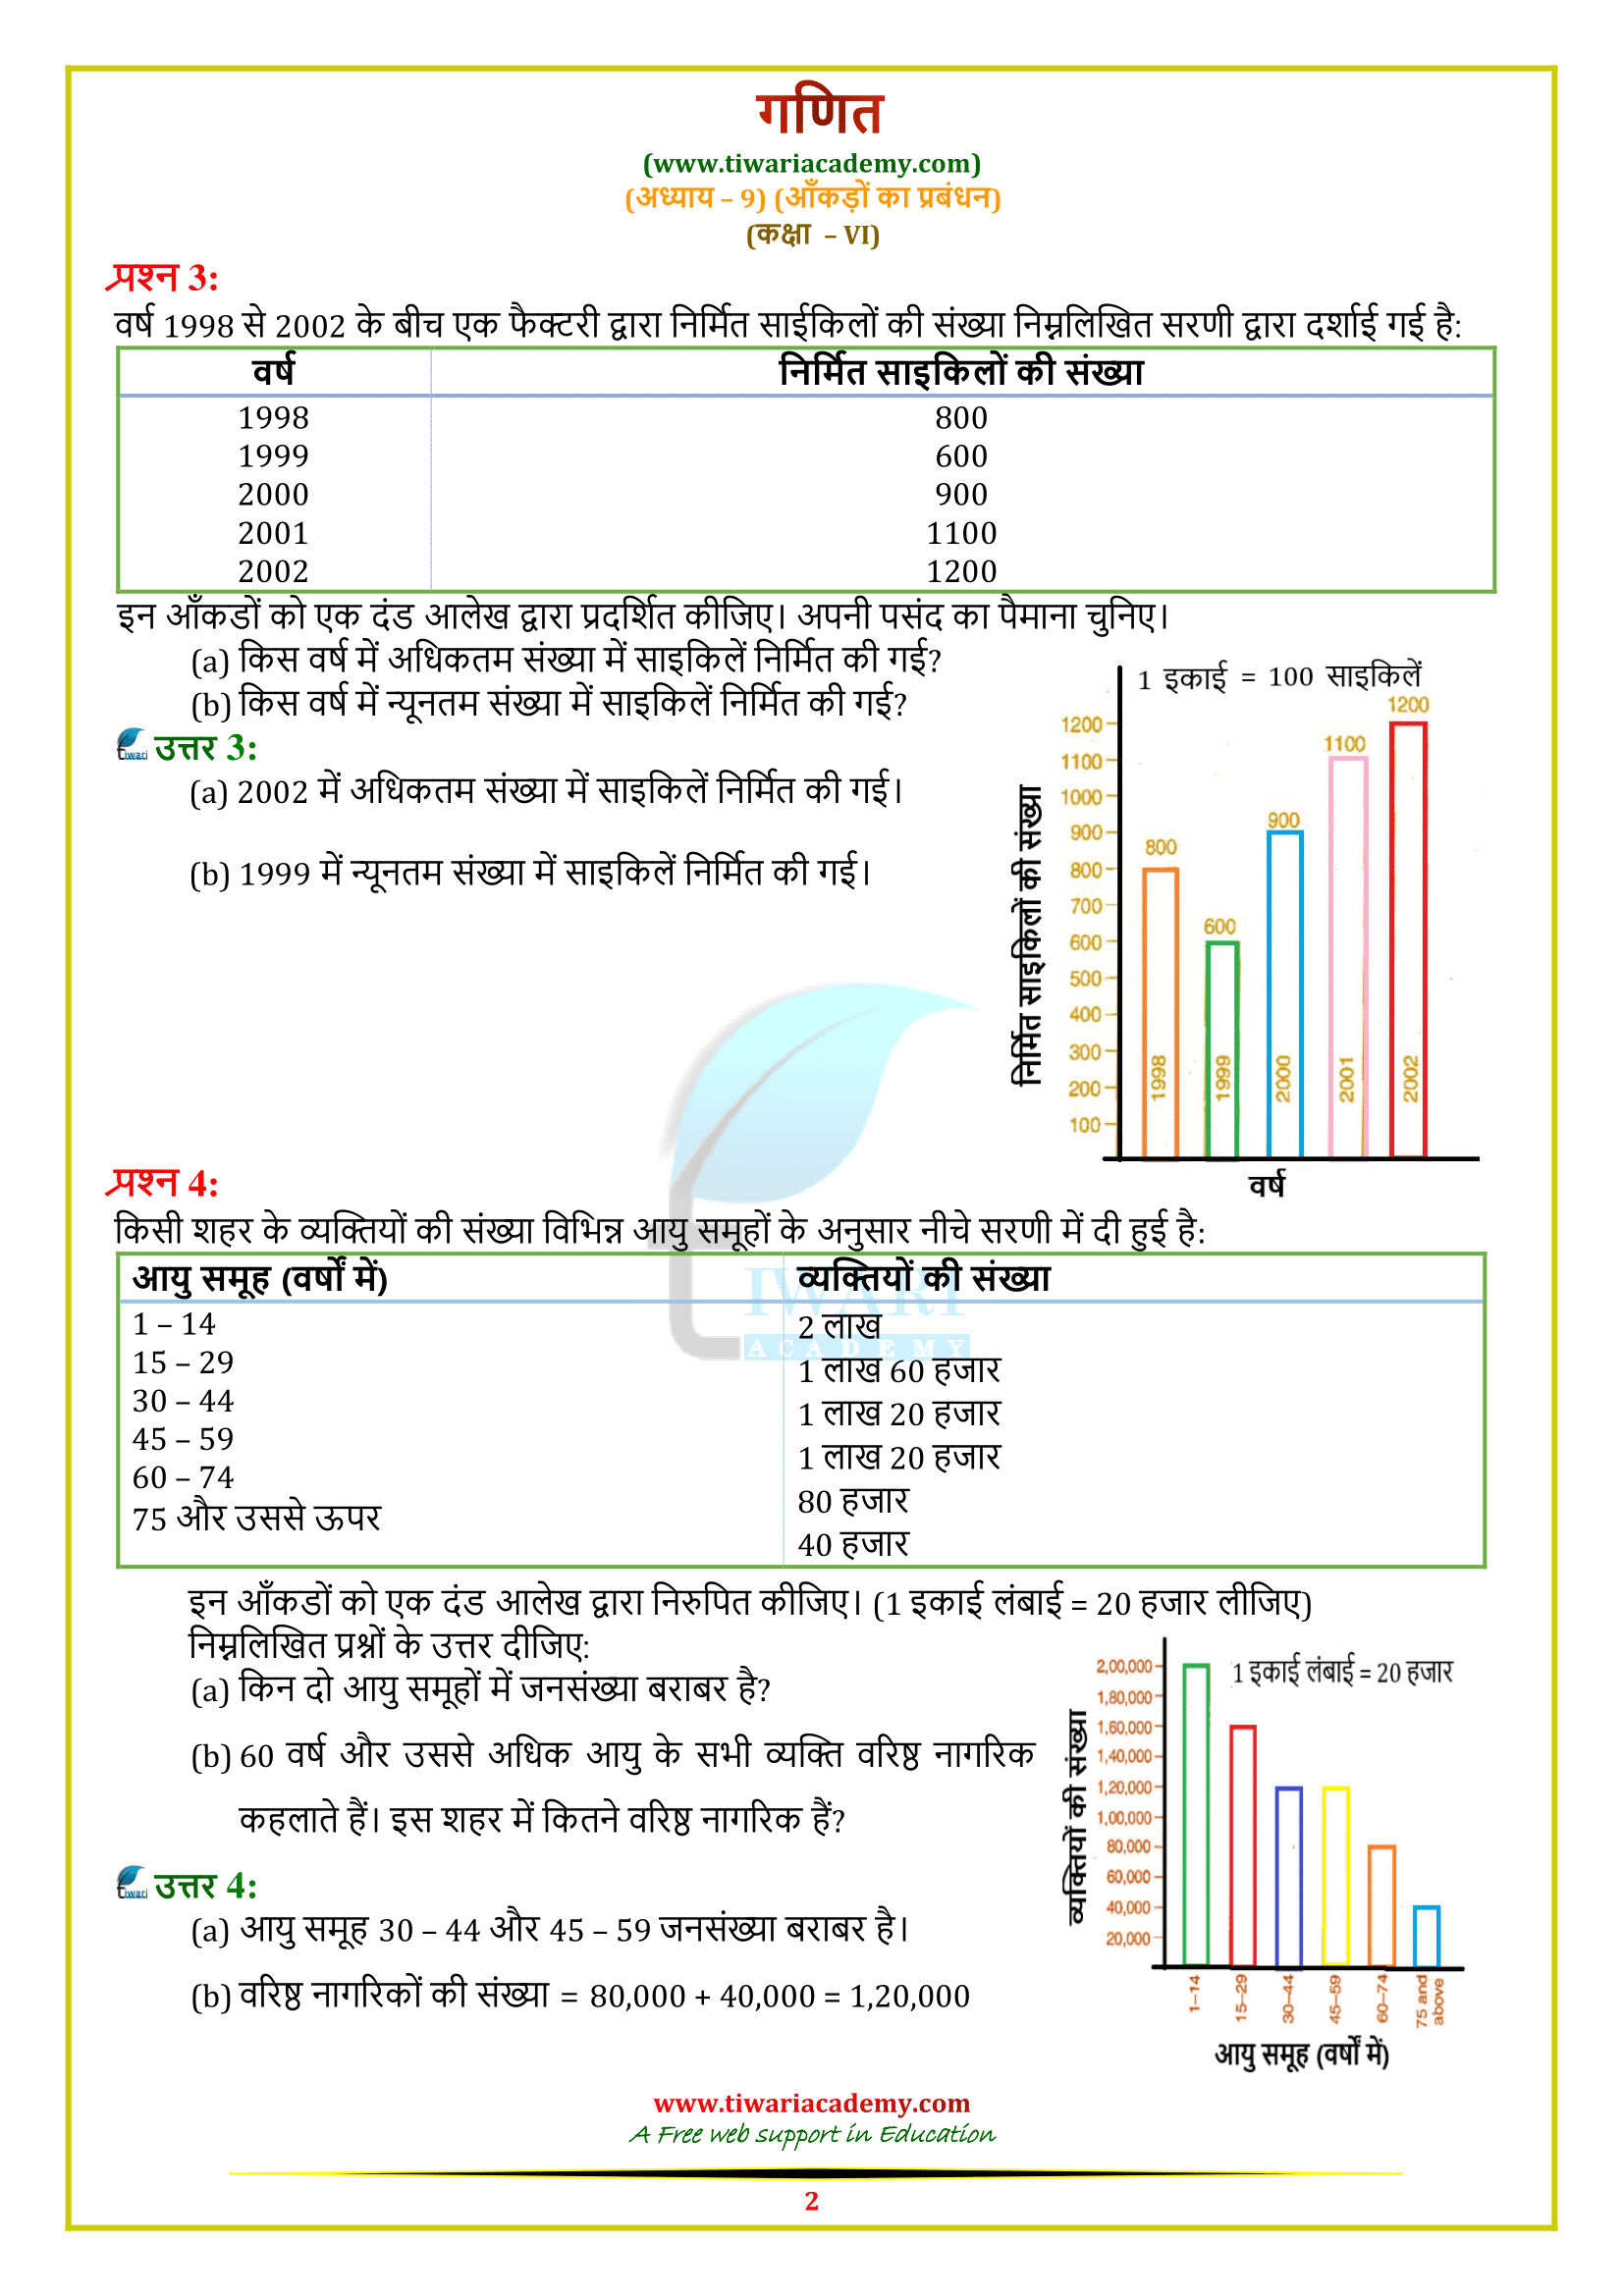
NCERT Solutions for Class 6 Maths Chapter 9 Exercise 9.4 Data Handling in Hindi and English Medium updated for CBSE as well as State Boards. Discover simplified solutions for Class 6 Maths NCERT, Chapter 9 Exercise 9.4 on Data Handling, in Hindi and English. Perfect for CBSE and state board students at Tiwari Academy.
6th Maths Exercise 9.4 Solutions in Hindi and English Medium
Class 6 Maths Chapter 9 Exercise 9.4 Solution
Class VI Mathematics NCERT book Ex. 9.4 of chapter 9 Data Handling free to download in PDF file or use online without downloading it. All the contents are free to use without any login or password. Class 6 math NCERT solutions are updated for CBSE new session with PDF and videos solutions. Questions are done by subject experts in easy to understand methods. Call us for help, if you are facing any problem using these contents.
| Class: 6 | Mathematics |
| Chapter: 9 | Exercise: 9.4 |
| Chapter Name: | Data Handling |
| Content: | NCERT Books Solutions |
| Medium: | Hindi and English Medium |
Histogram
The bar graph is a pictorial representation of numerical data in the form of rectangles of equal width and varying heights. The dimensions of a rectangle depend on the numerical value it represents. Now, we will study to represent a continuous grouped frequency distribution graphically. The graphical representation of a continuous grouped frequency distribution is called a histogram.
Class 6 Maths Exercise 9.4 Extra Question with Answer
How are histograms used in real life?
The primary use of a Histogram Chart is to display the distribution (or “shape”) of the values in a data series. For example, we might know that normal human oral body temperature is approx 98.6 degrees Fahrenheit. … To test this, we might sample 300 healthy persons and measure their oral temperature.
What information can be found in a histogram?
A histogram is used to summarize discrete or continuous data. In other words, it provides a visual interpretation. This requires focusing on the main points, factsof numerical data by showing the number of data points that fall within a specified range of values (called “bins”). It is similar to a vertical bar graph.
Histogram is a type of bar diagram where the class intervals are shown on the horizontal axis and the heights of the bars shows the frequency of the class intervals. It is a vertical bar graph with no spacing between the bars.
Class 6 Maths Exercise 9.4 Important Questions
How do you describe a bimodal histogram?
Basically, a bimodal histogram is just a histogram with two obvious relative modes, or data peaks. … This makes the data bimodal since there are two separate periods during the day that correspond to peak serving times.
What is a symmetrical histogram?
A symmetric distribution is one in which the 2 “halves” of the histogram appear as mirror-images of one another. A skewed (non-symmetric) distribution is a distribution in which there is no such mirror-imaging.
How do you describe a normal distribution histogram?
Just by looking at a probability histogram, you can tell if it is normal by looking at its shape. If the graph is approximately bell-shaped and symmetric about the mean, you can usually assume normality. A normal probability plot is another method used to assess normality.
Steps to draw a histogram:
- Draw two lines, one horizontal and other vertical, intersecting at O (say). Mark them as OX and OY representing x-axis and y-axis respectively.
- Choose a suitable scale for x-axis and represent class limits along this axis.
- Choose a suitable scale for y-axis (not necessarily same as x-axis) and represent frequencies along this axis.
- Construct rectangles with class-intervals as bases and respective frequencies as heights, so that areas of rectangles are proportional to the frequencies of corresponding classes.
Is exercise 9.4 of class 6th Maths important for terminal exams?
Yes, exercise 9.4 of class 6th Maths is important from an exam point of view. Questions can come from exercise 9.4 of class 6th Maths in the exams. All problems (1 example (example 10) and 4 questions) of this exercise are significant for the exams. Students can’t skip any problem of this exercise from an exam point of view.
How much time, students require to prepare exercise 9.4 of standard 6 Maths for the terminal test?
A maximum of 2 days is required to prepare exercise 9.4 of grade 6th Maths for the terminal test because this exercise is short. This time is an approximate time and can vary. This time also depends on student’s ability, efficiency, working speed, and many other factors.
Do students face any problems while doing exercise 9.4 of grade 6th Maths?
No, Students do not face any problems while doing exercise 9.4 of grade 6th Maths. Exercise 9.4 of class 6th Maths is overall an easy exercise. Once students know how to draw bar graphs, they easily draw bar graphs.
What are the main topics to study in exercise 9.4 of class 6 Maths?
In exercise 9.4 of class 6th Maths, students will study how to draw Bar graphs. Drawing a bar graph is very interesting. In this exercise, there are 5 sums (1 example and 4 questions). In all sums of this exercise, first, students have to draw a bar graph and then answer the given questions using the bar graph.


