NCERT Solutions for Class 5 Maths Chapter 12 Smart Charts from Math-Magic in English and Hindi updated for new session CBSE 2025-26. When data is expressed visually through diagrams and graphs, they help you understand it better. In Chapter 12 of Grade 5 Mathematics, you will learn to represent data through tables, draw conclusions, and solve various problems. Extra practice book is also available to free download.
Study Planner for Class 5 Maths
NCERT Solutions for Class 5 Maths Chapter 12
5th Standard NCERT Maths Aim of the Chapter 12
In the previous chapters, you have studied how important is the role of data it can play in your work if you use the smart charts to keep the record of your work in order to remember it. We have also studied how creatively one can make charts that can contain important data that can be studied by anyone and understood by anyone.
Class 5 NCERT Maths Chapter 12 Activity
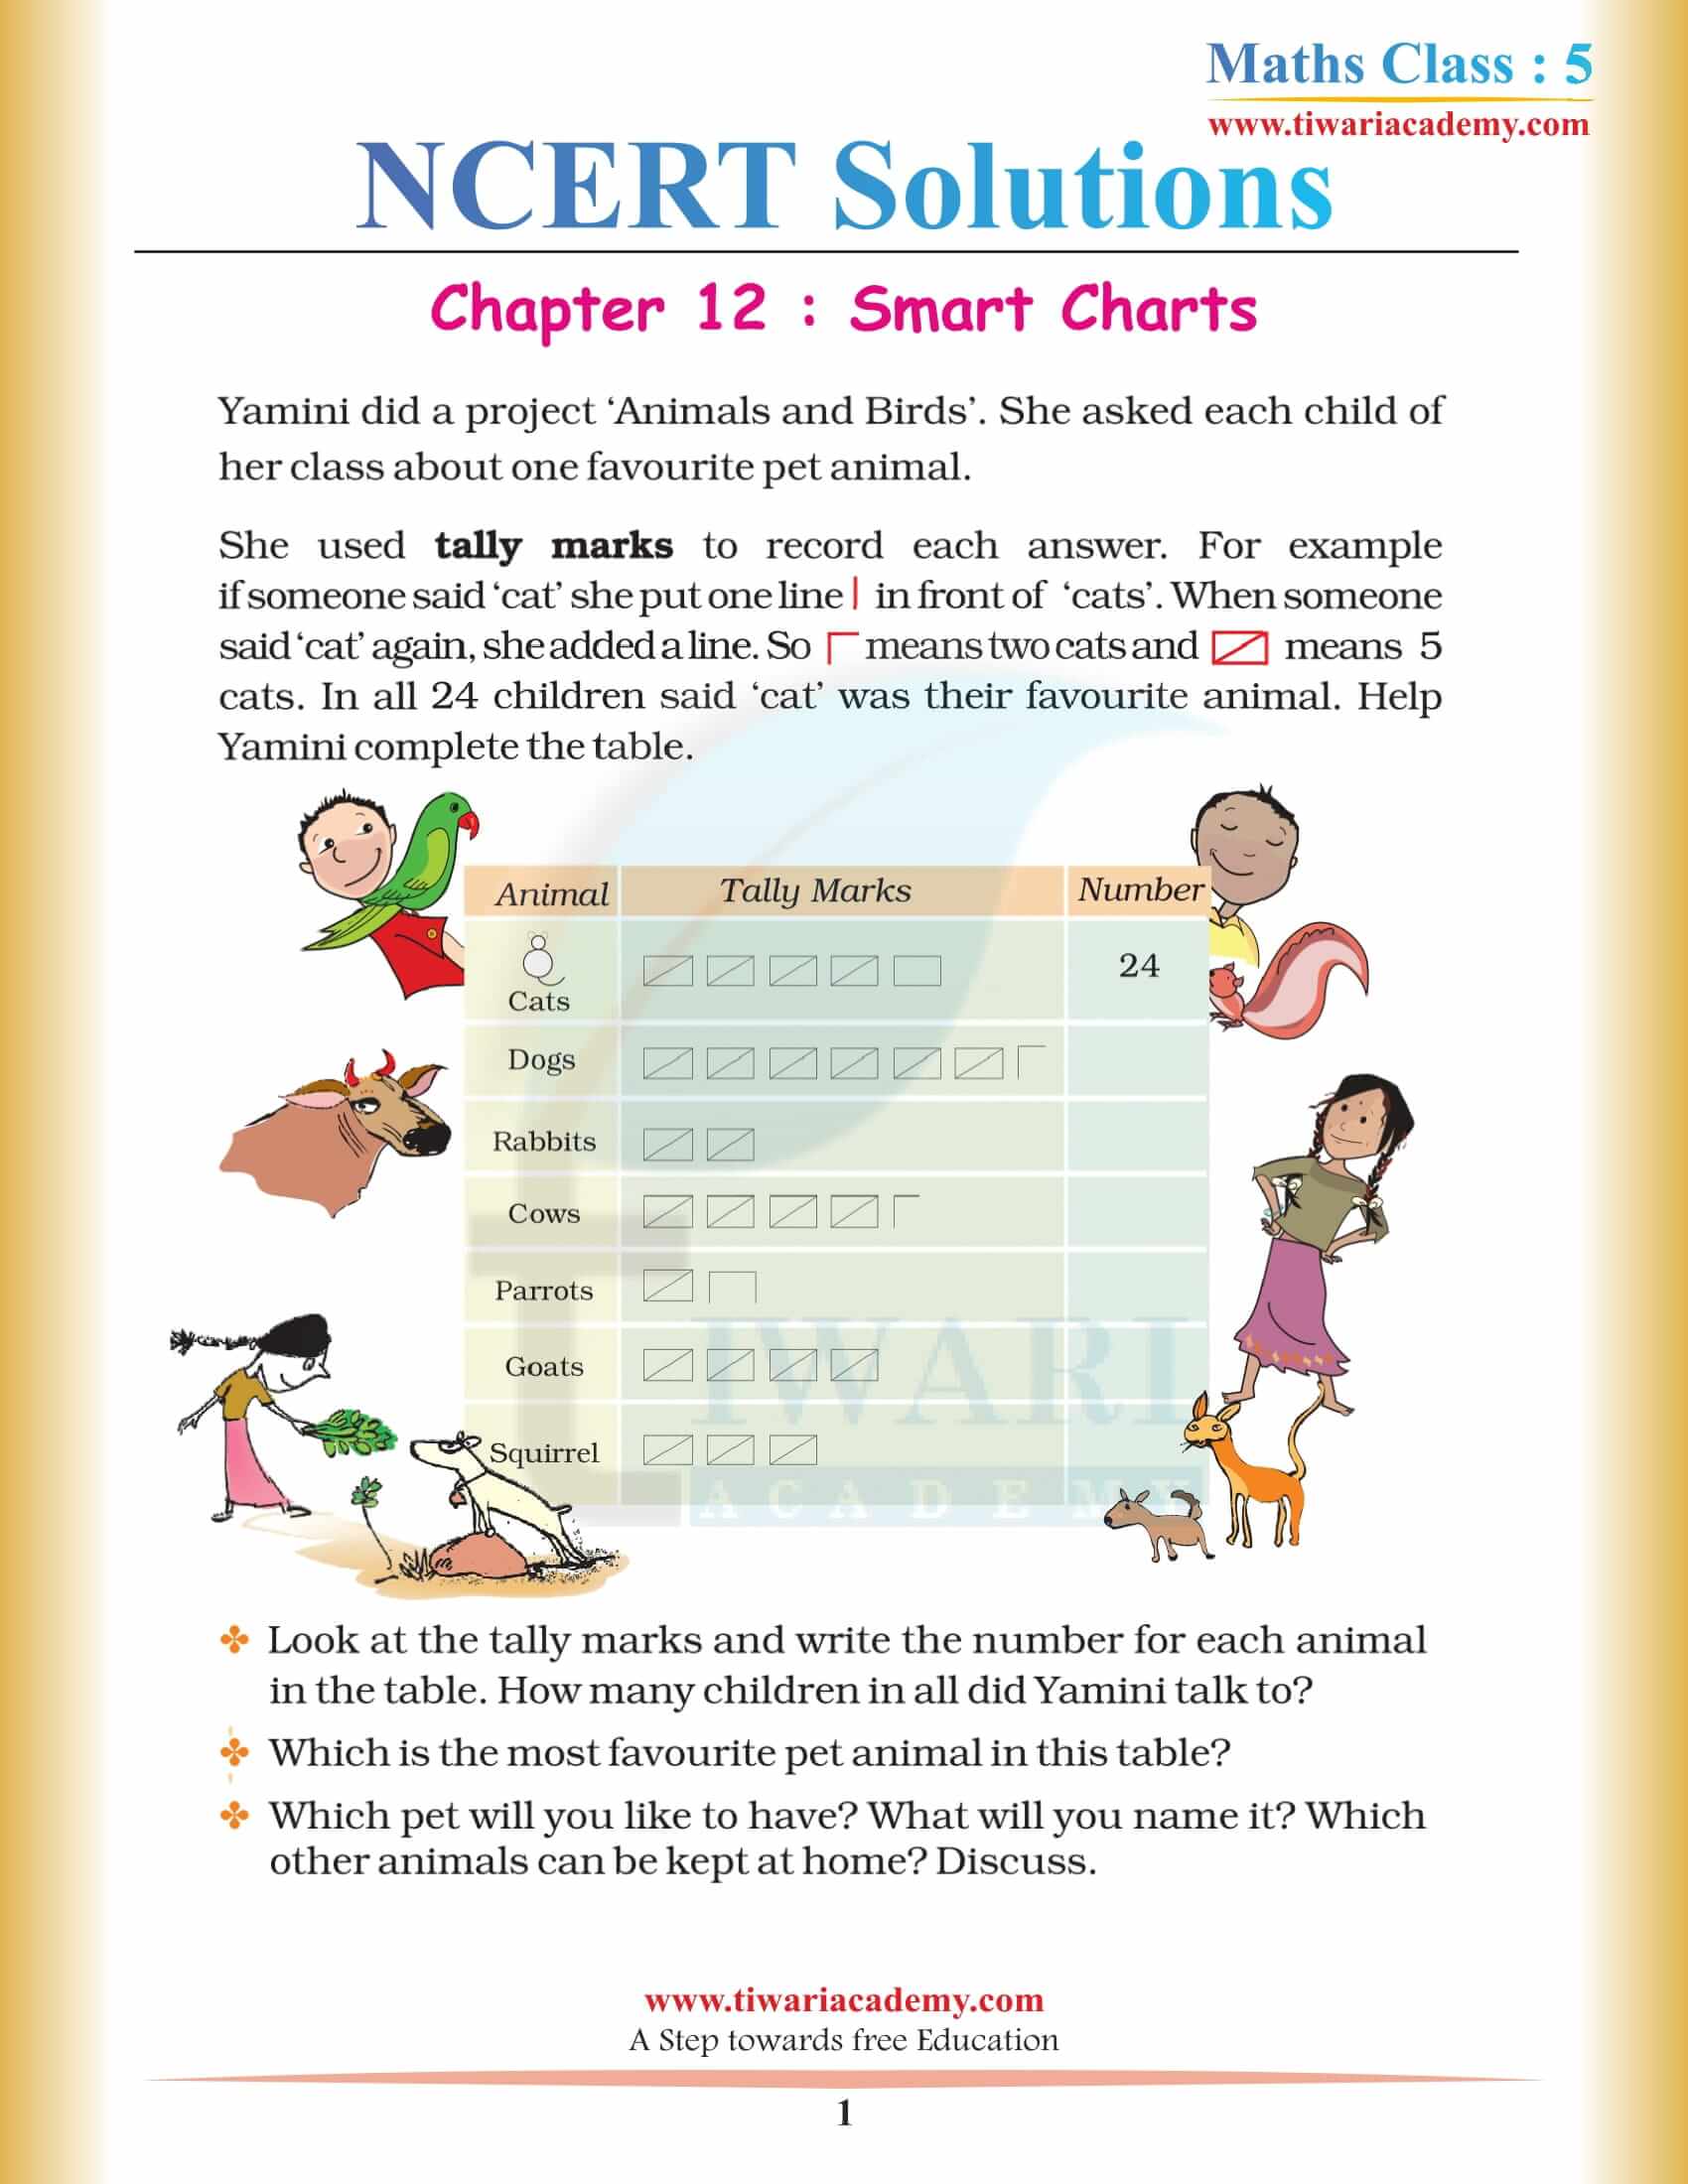
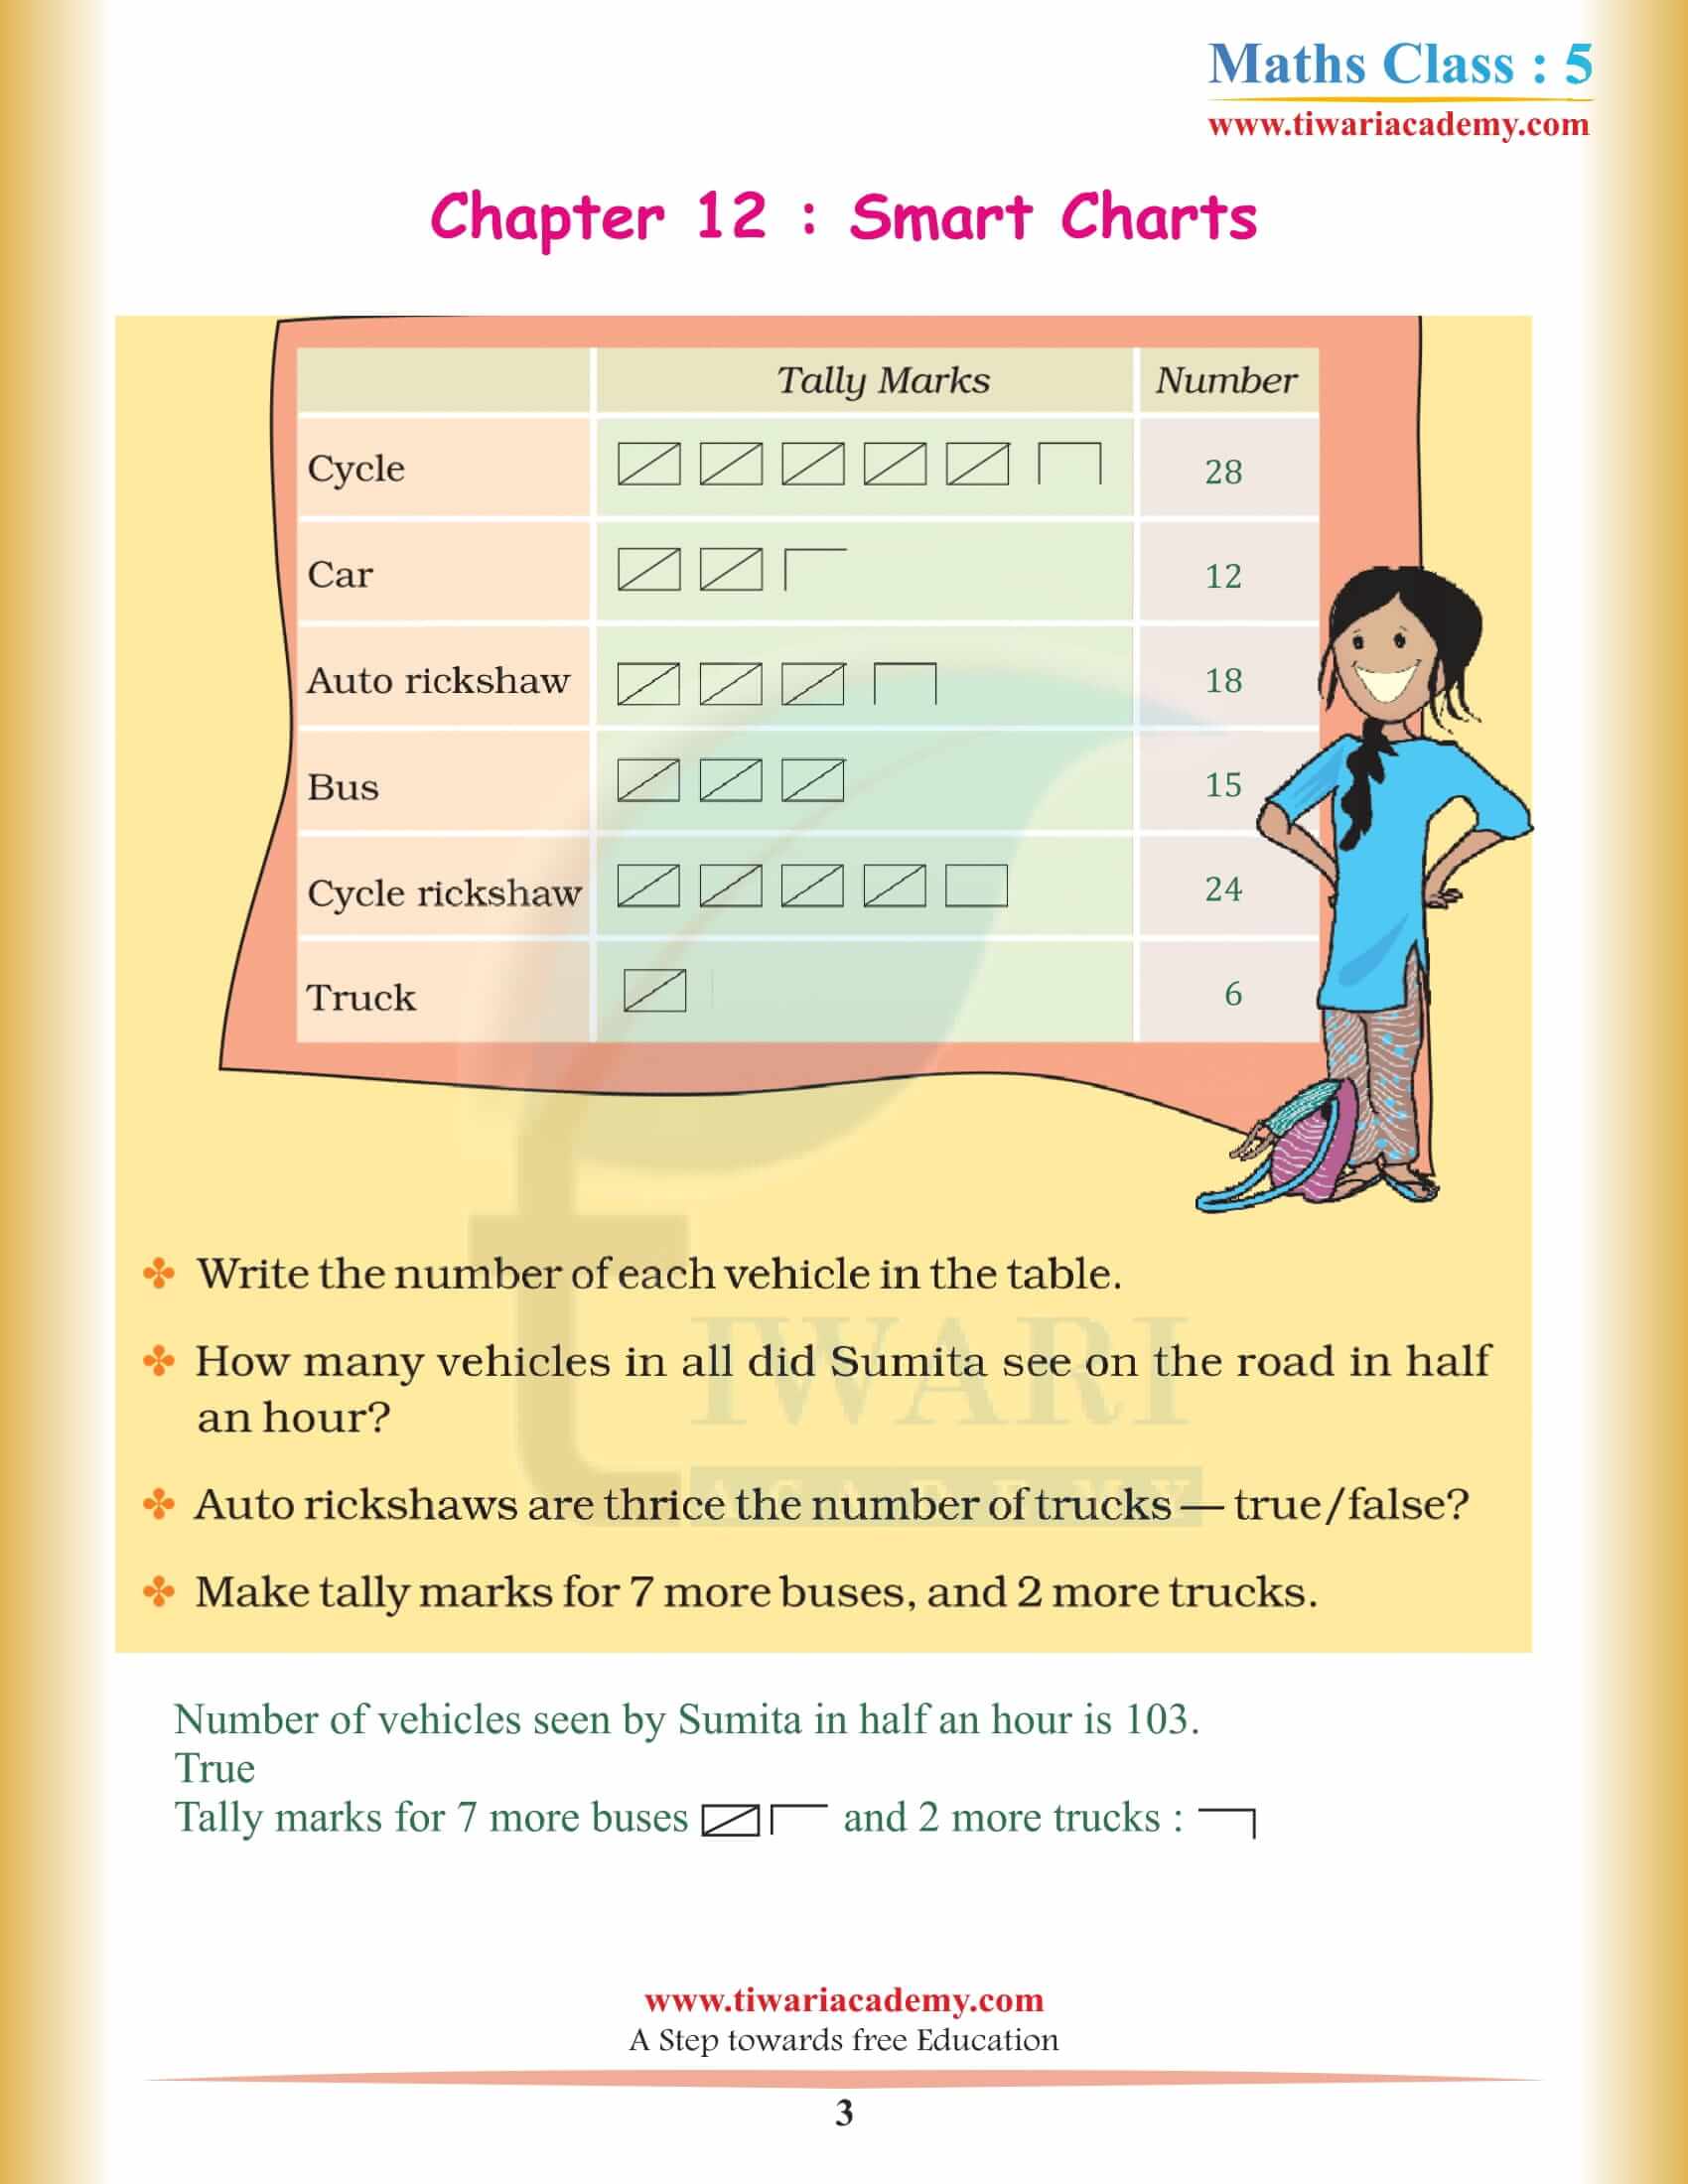
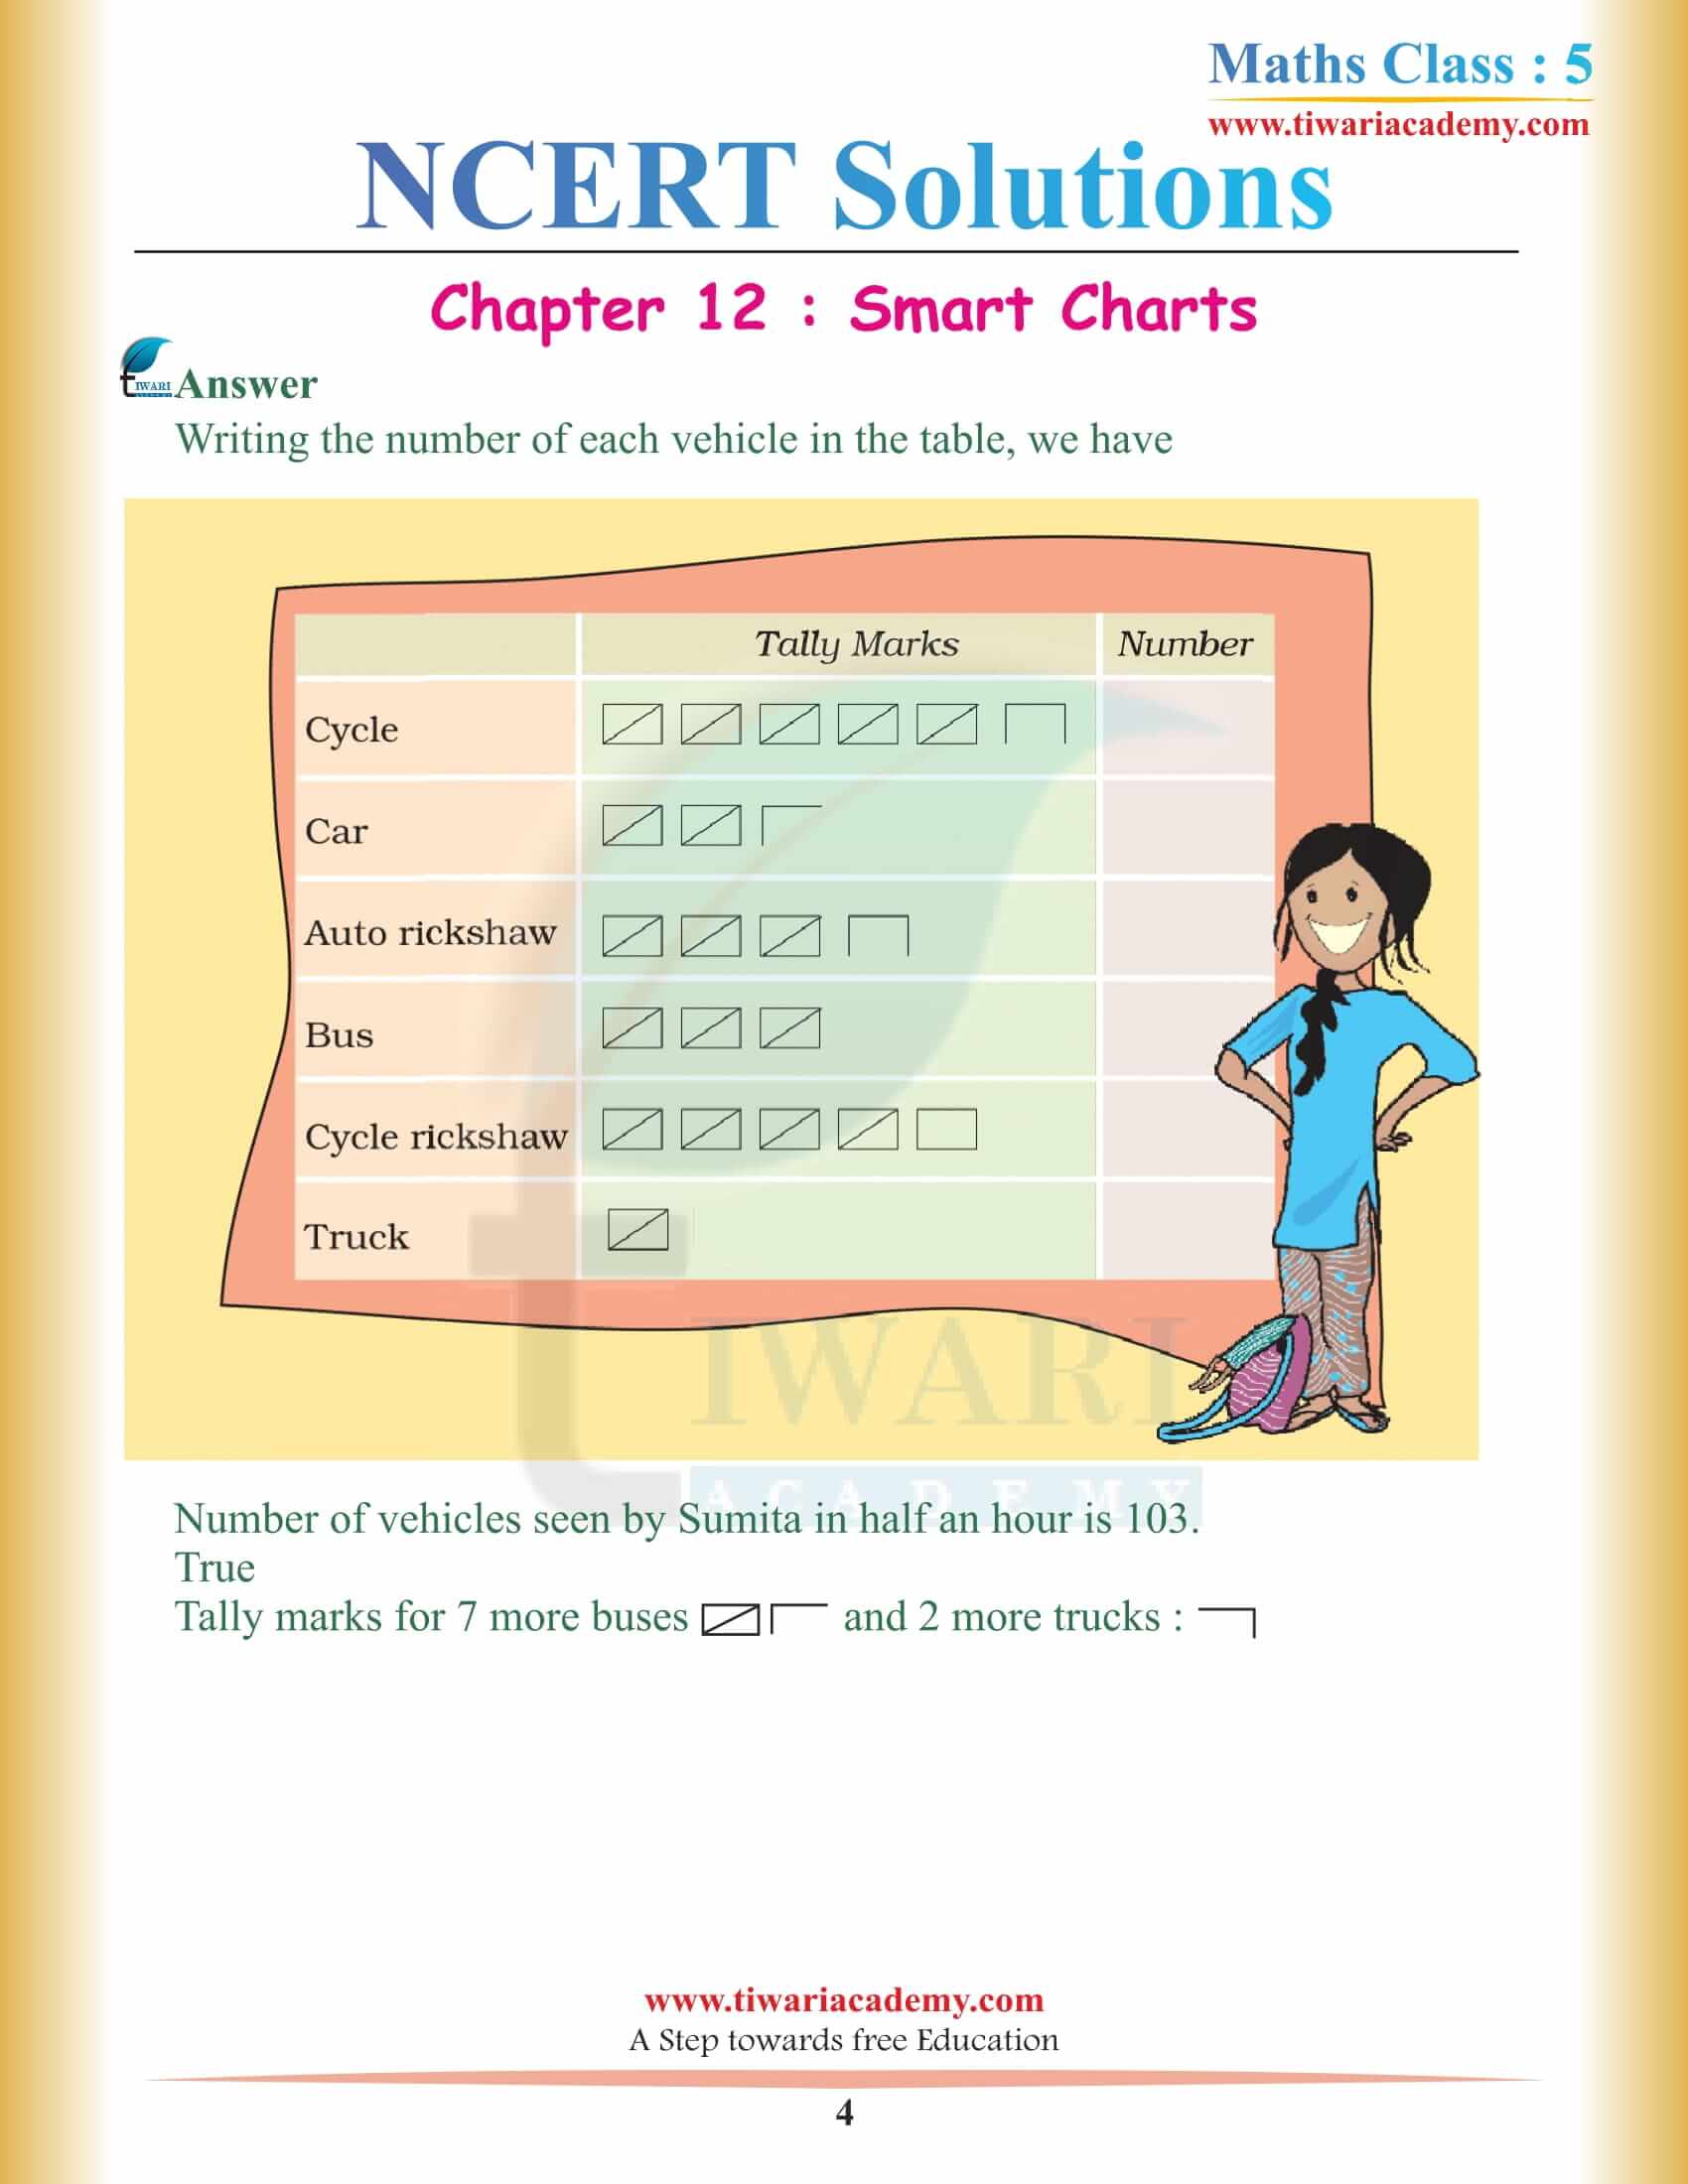
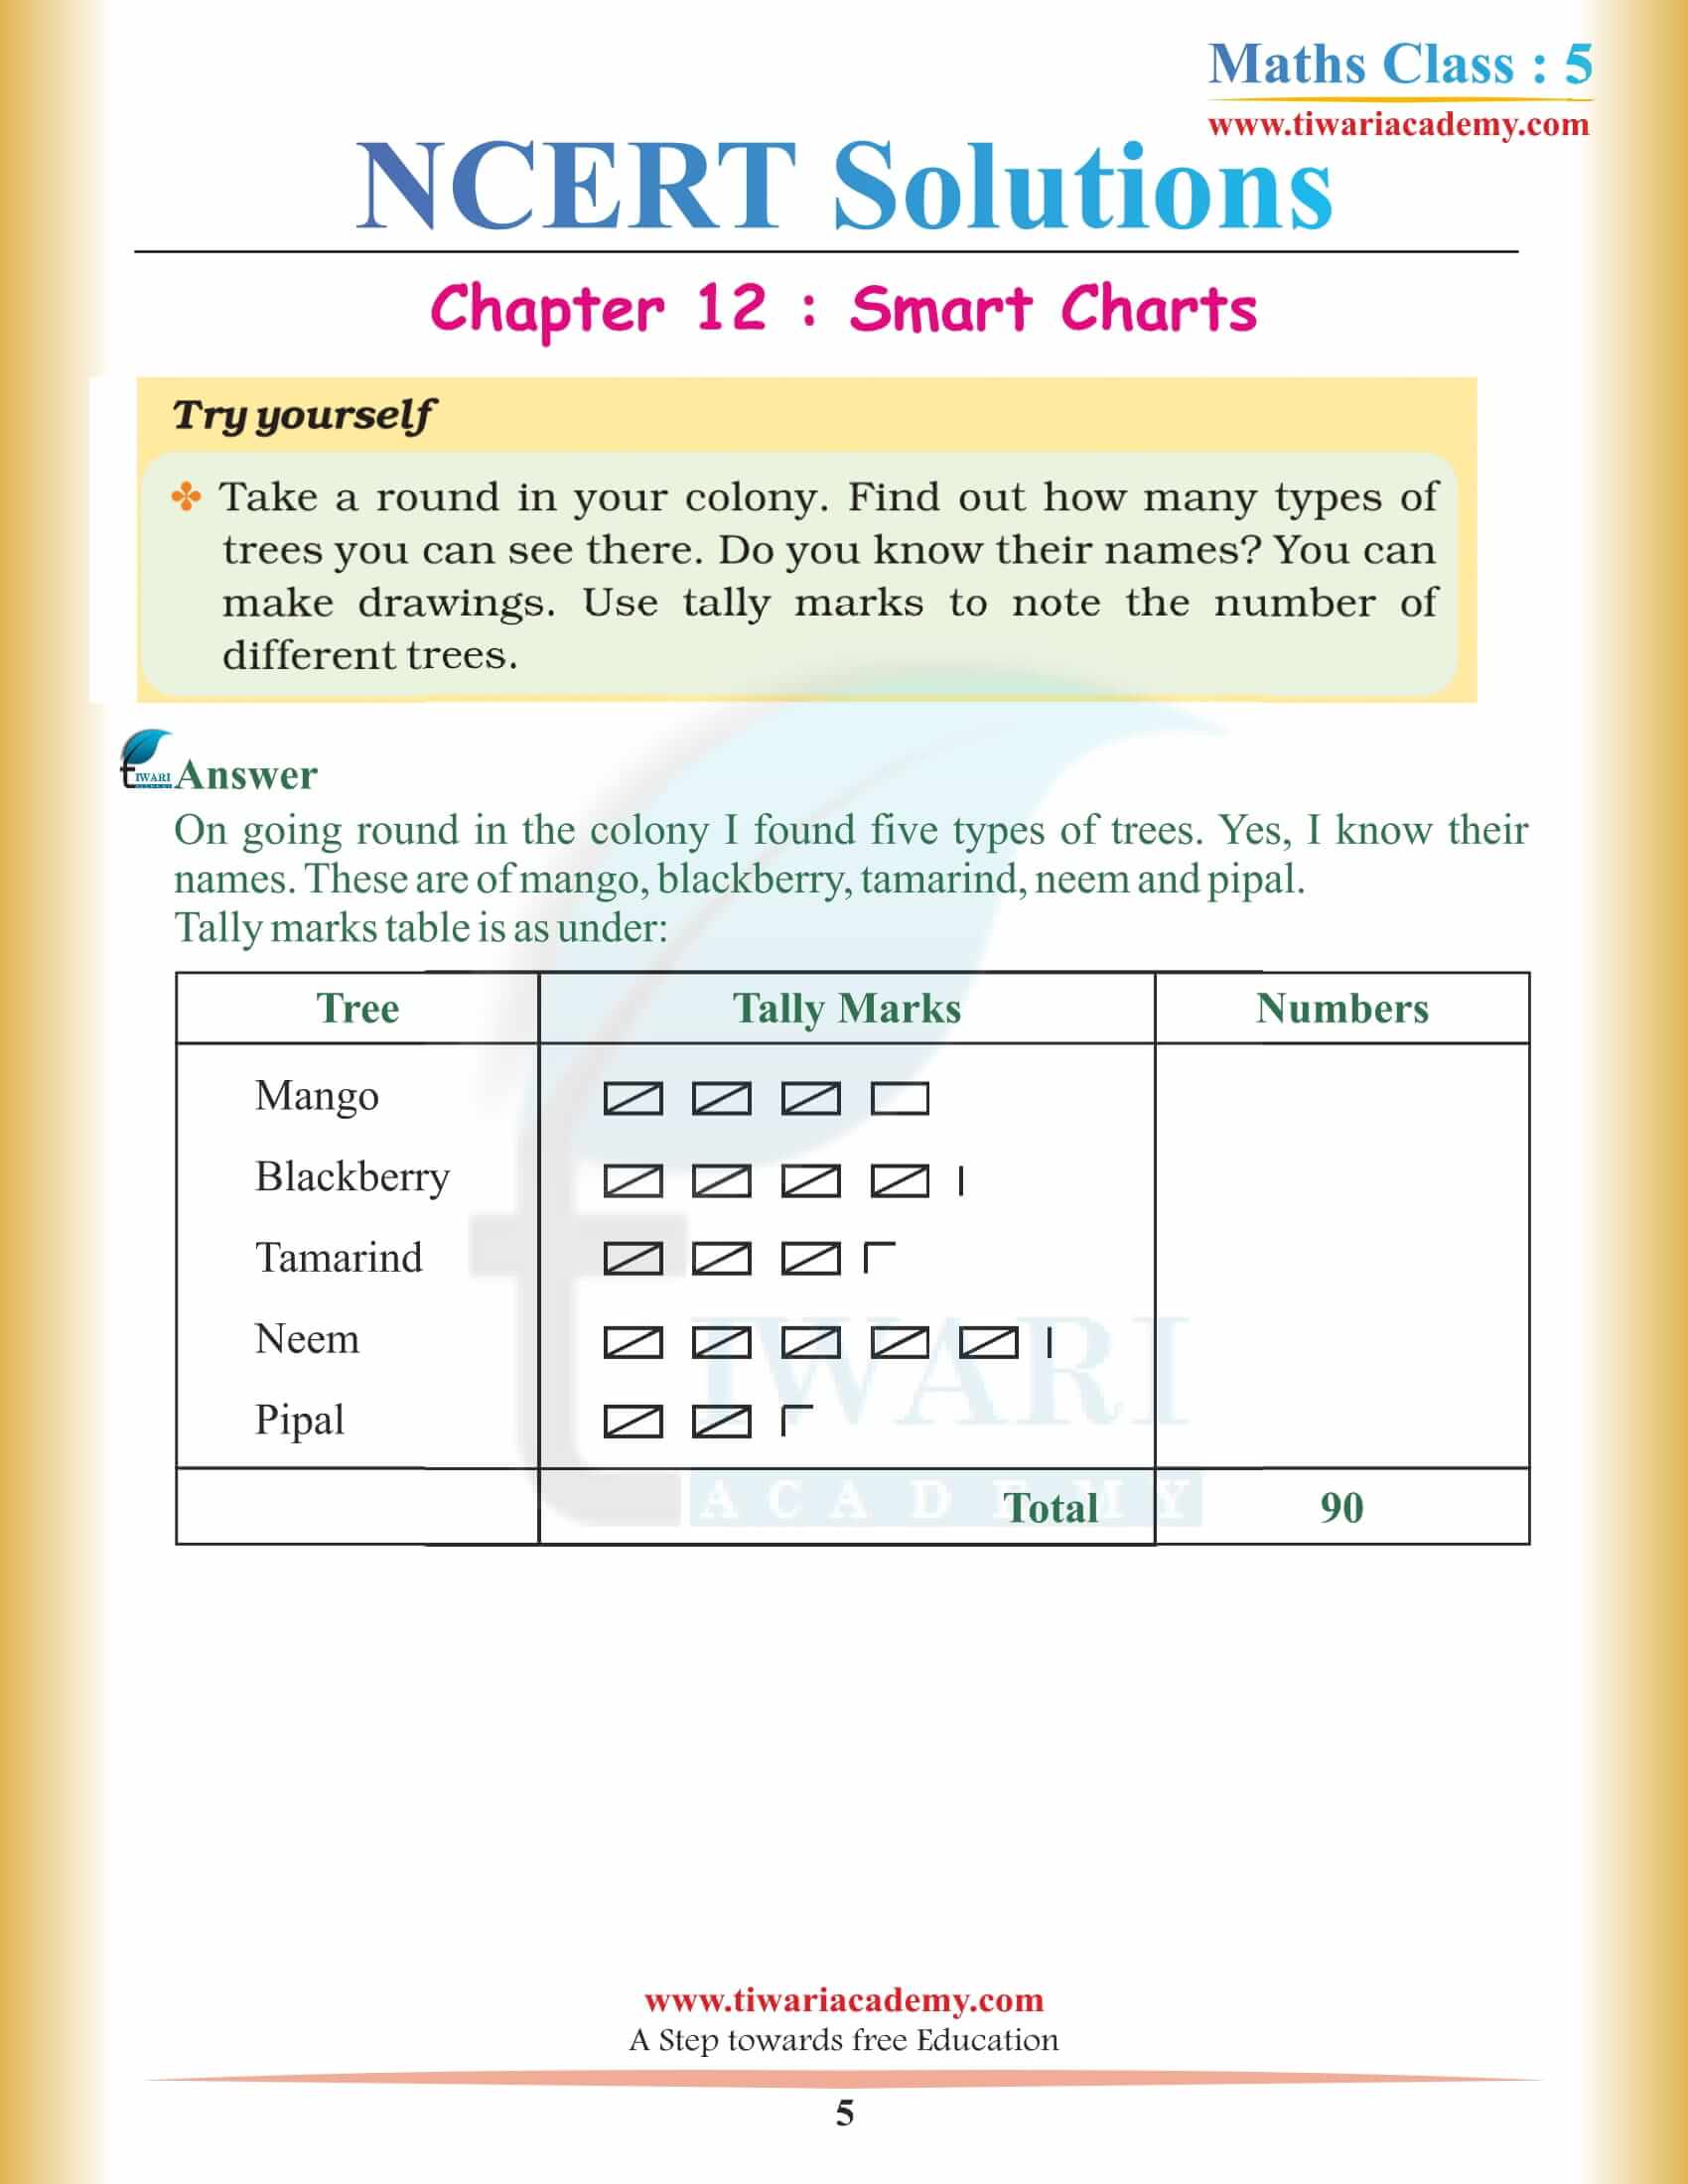
Have you ever played the game with your friends or anyone counting red-colored vehicles as Sumita did alone? She counted each vehicle. You can count each vehicle that is red color like Red car, truck bus or any other vehicle during a particular time and then check if the next day same vehicles appear.
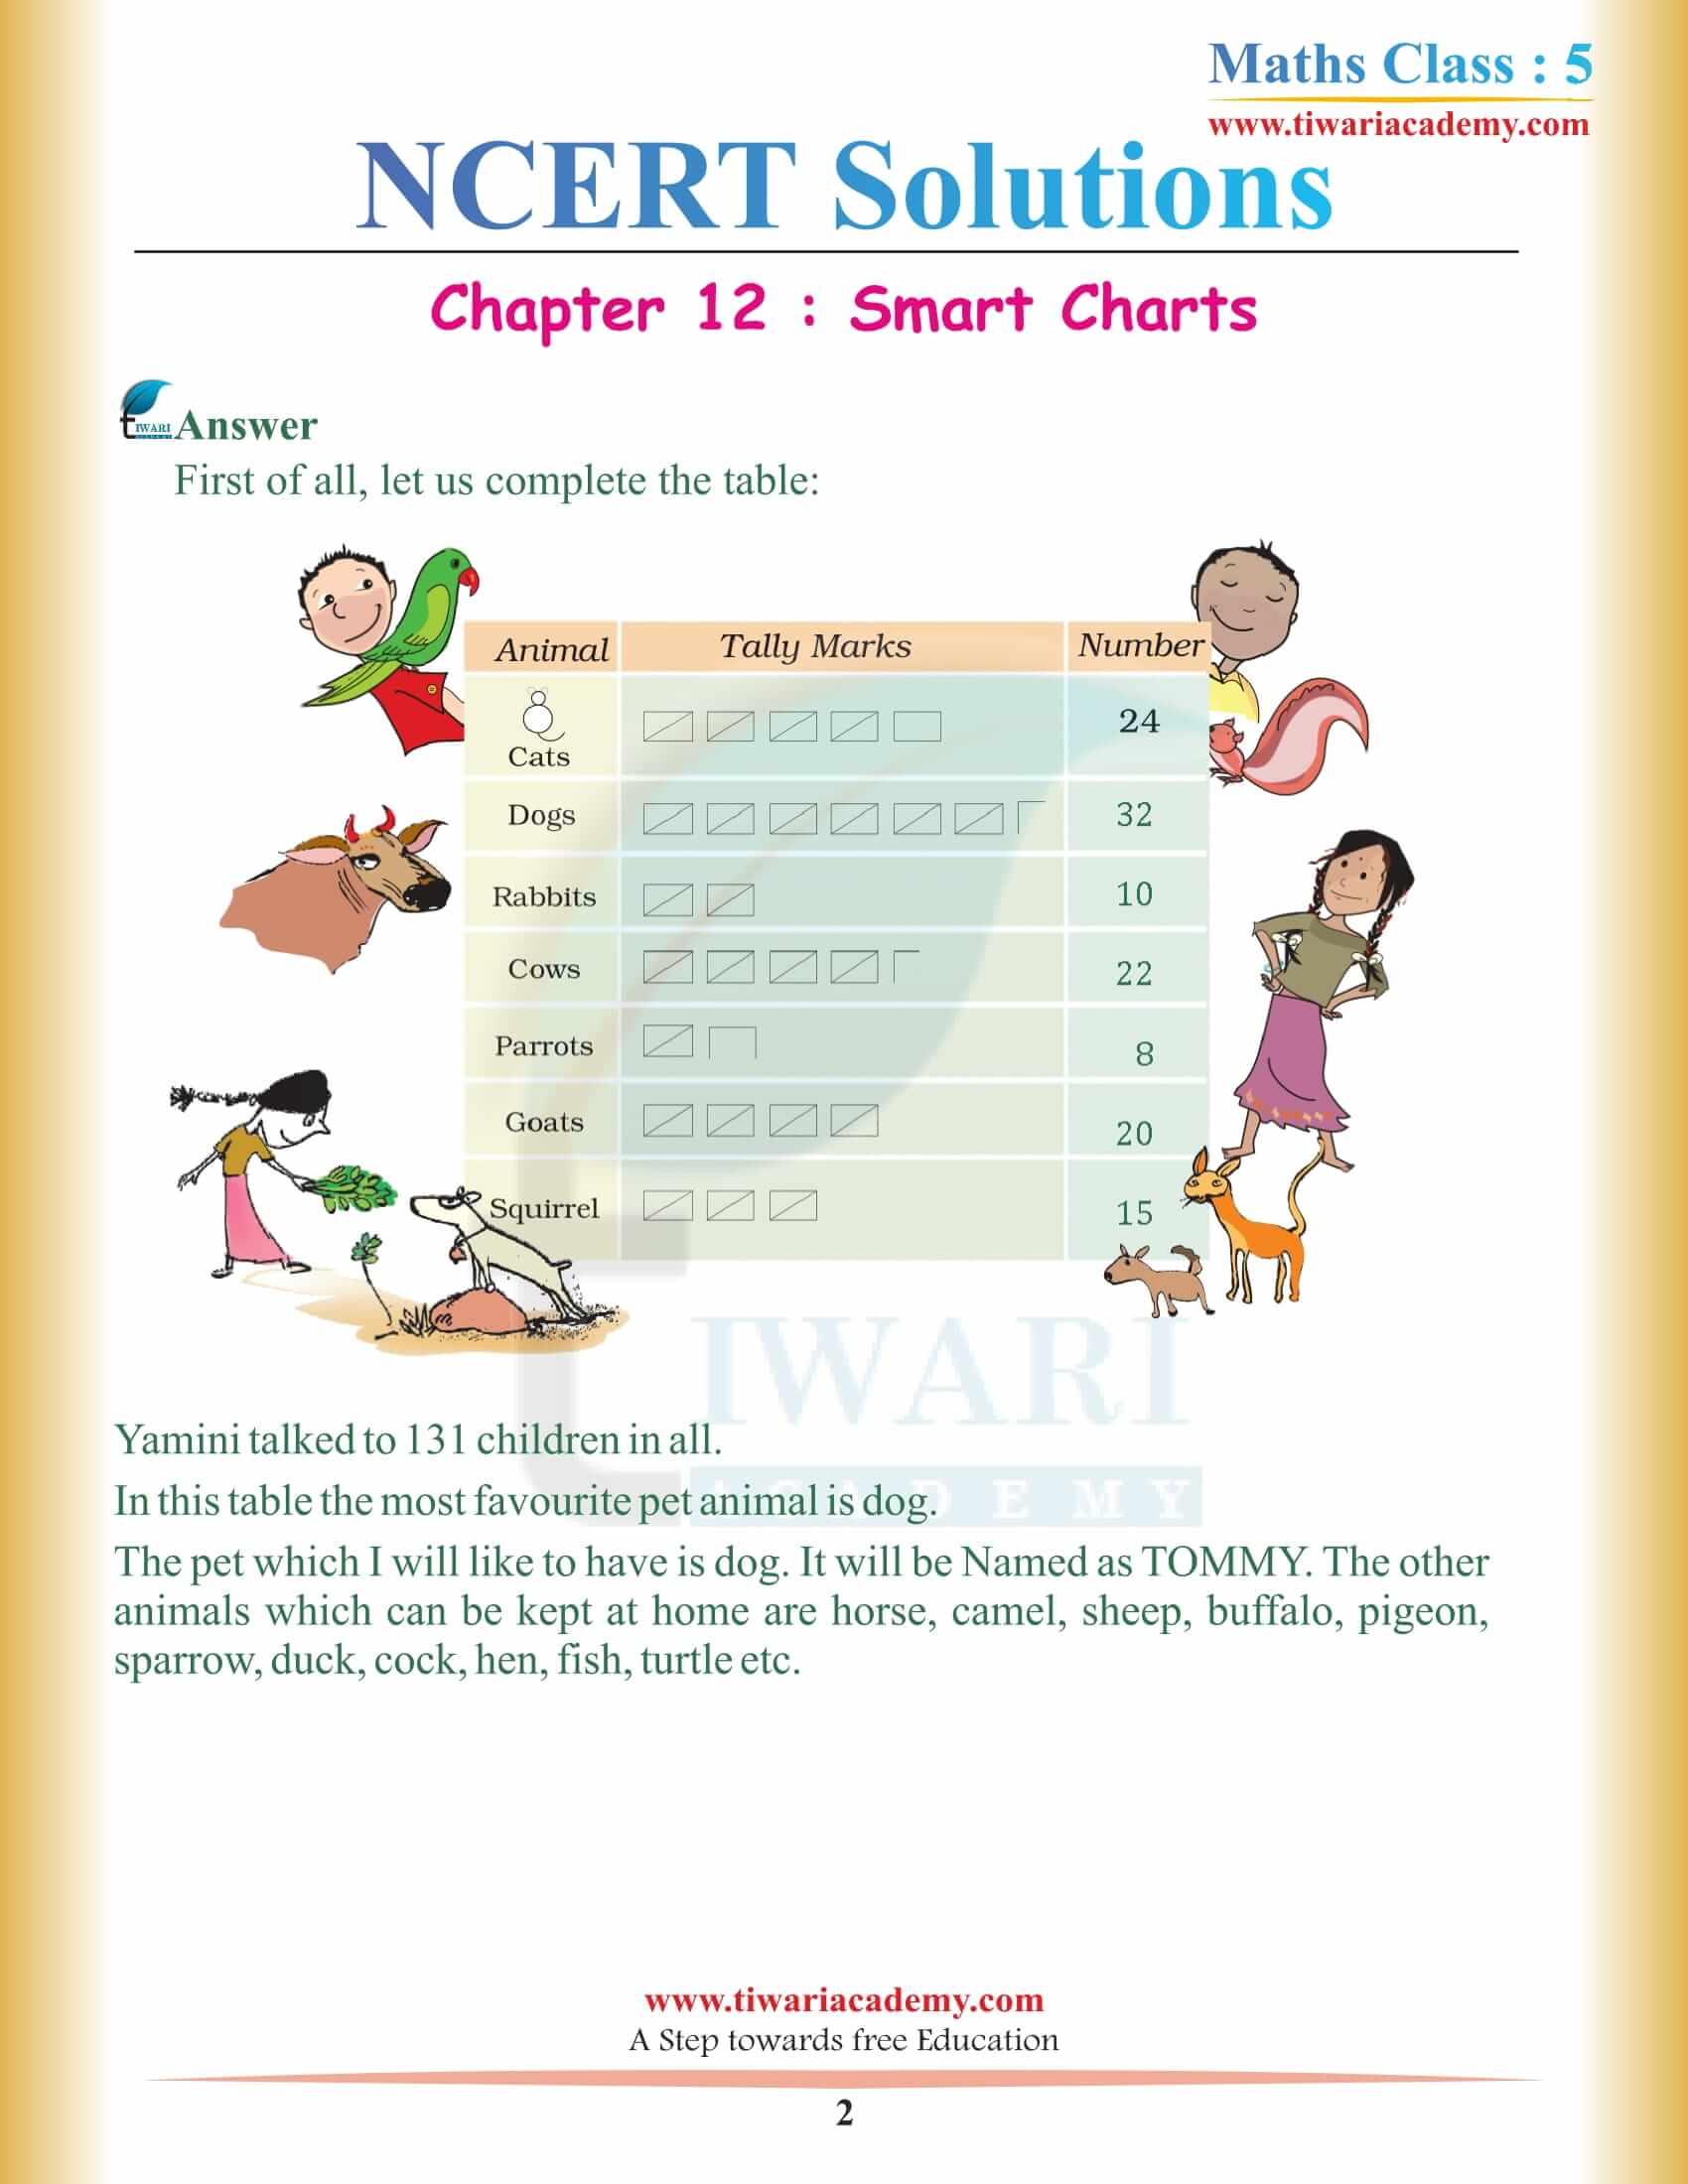
But counting and remembering the number of cars and other vehicles could be a challenge for all the people and writing normally could not be a creative solution for the problem. So, what you can do, like Sumita you can make a chart for each category of vehicles and create a chart with different boxes with different vehicle types and then mention its number.
CBSE Class 5 NCERT Maths Book Chapter 12 Use of Data
Once you do this then you will find that it is easy to make the chart and understand it not just for only one or two days you can make the data for the entire month. Sound Big job right? Yes, it is. Well, you can say this is the best way one can remember the job and understand how all the things work and then when you need to know on which day how many cars passed through your area. You can simply go through the chart and then answer it.
5th Maths Chapter 12 Idea of Study the Chapter
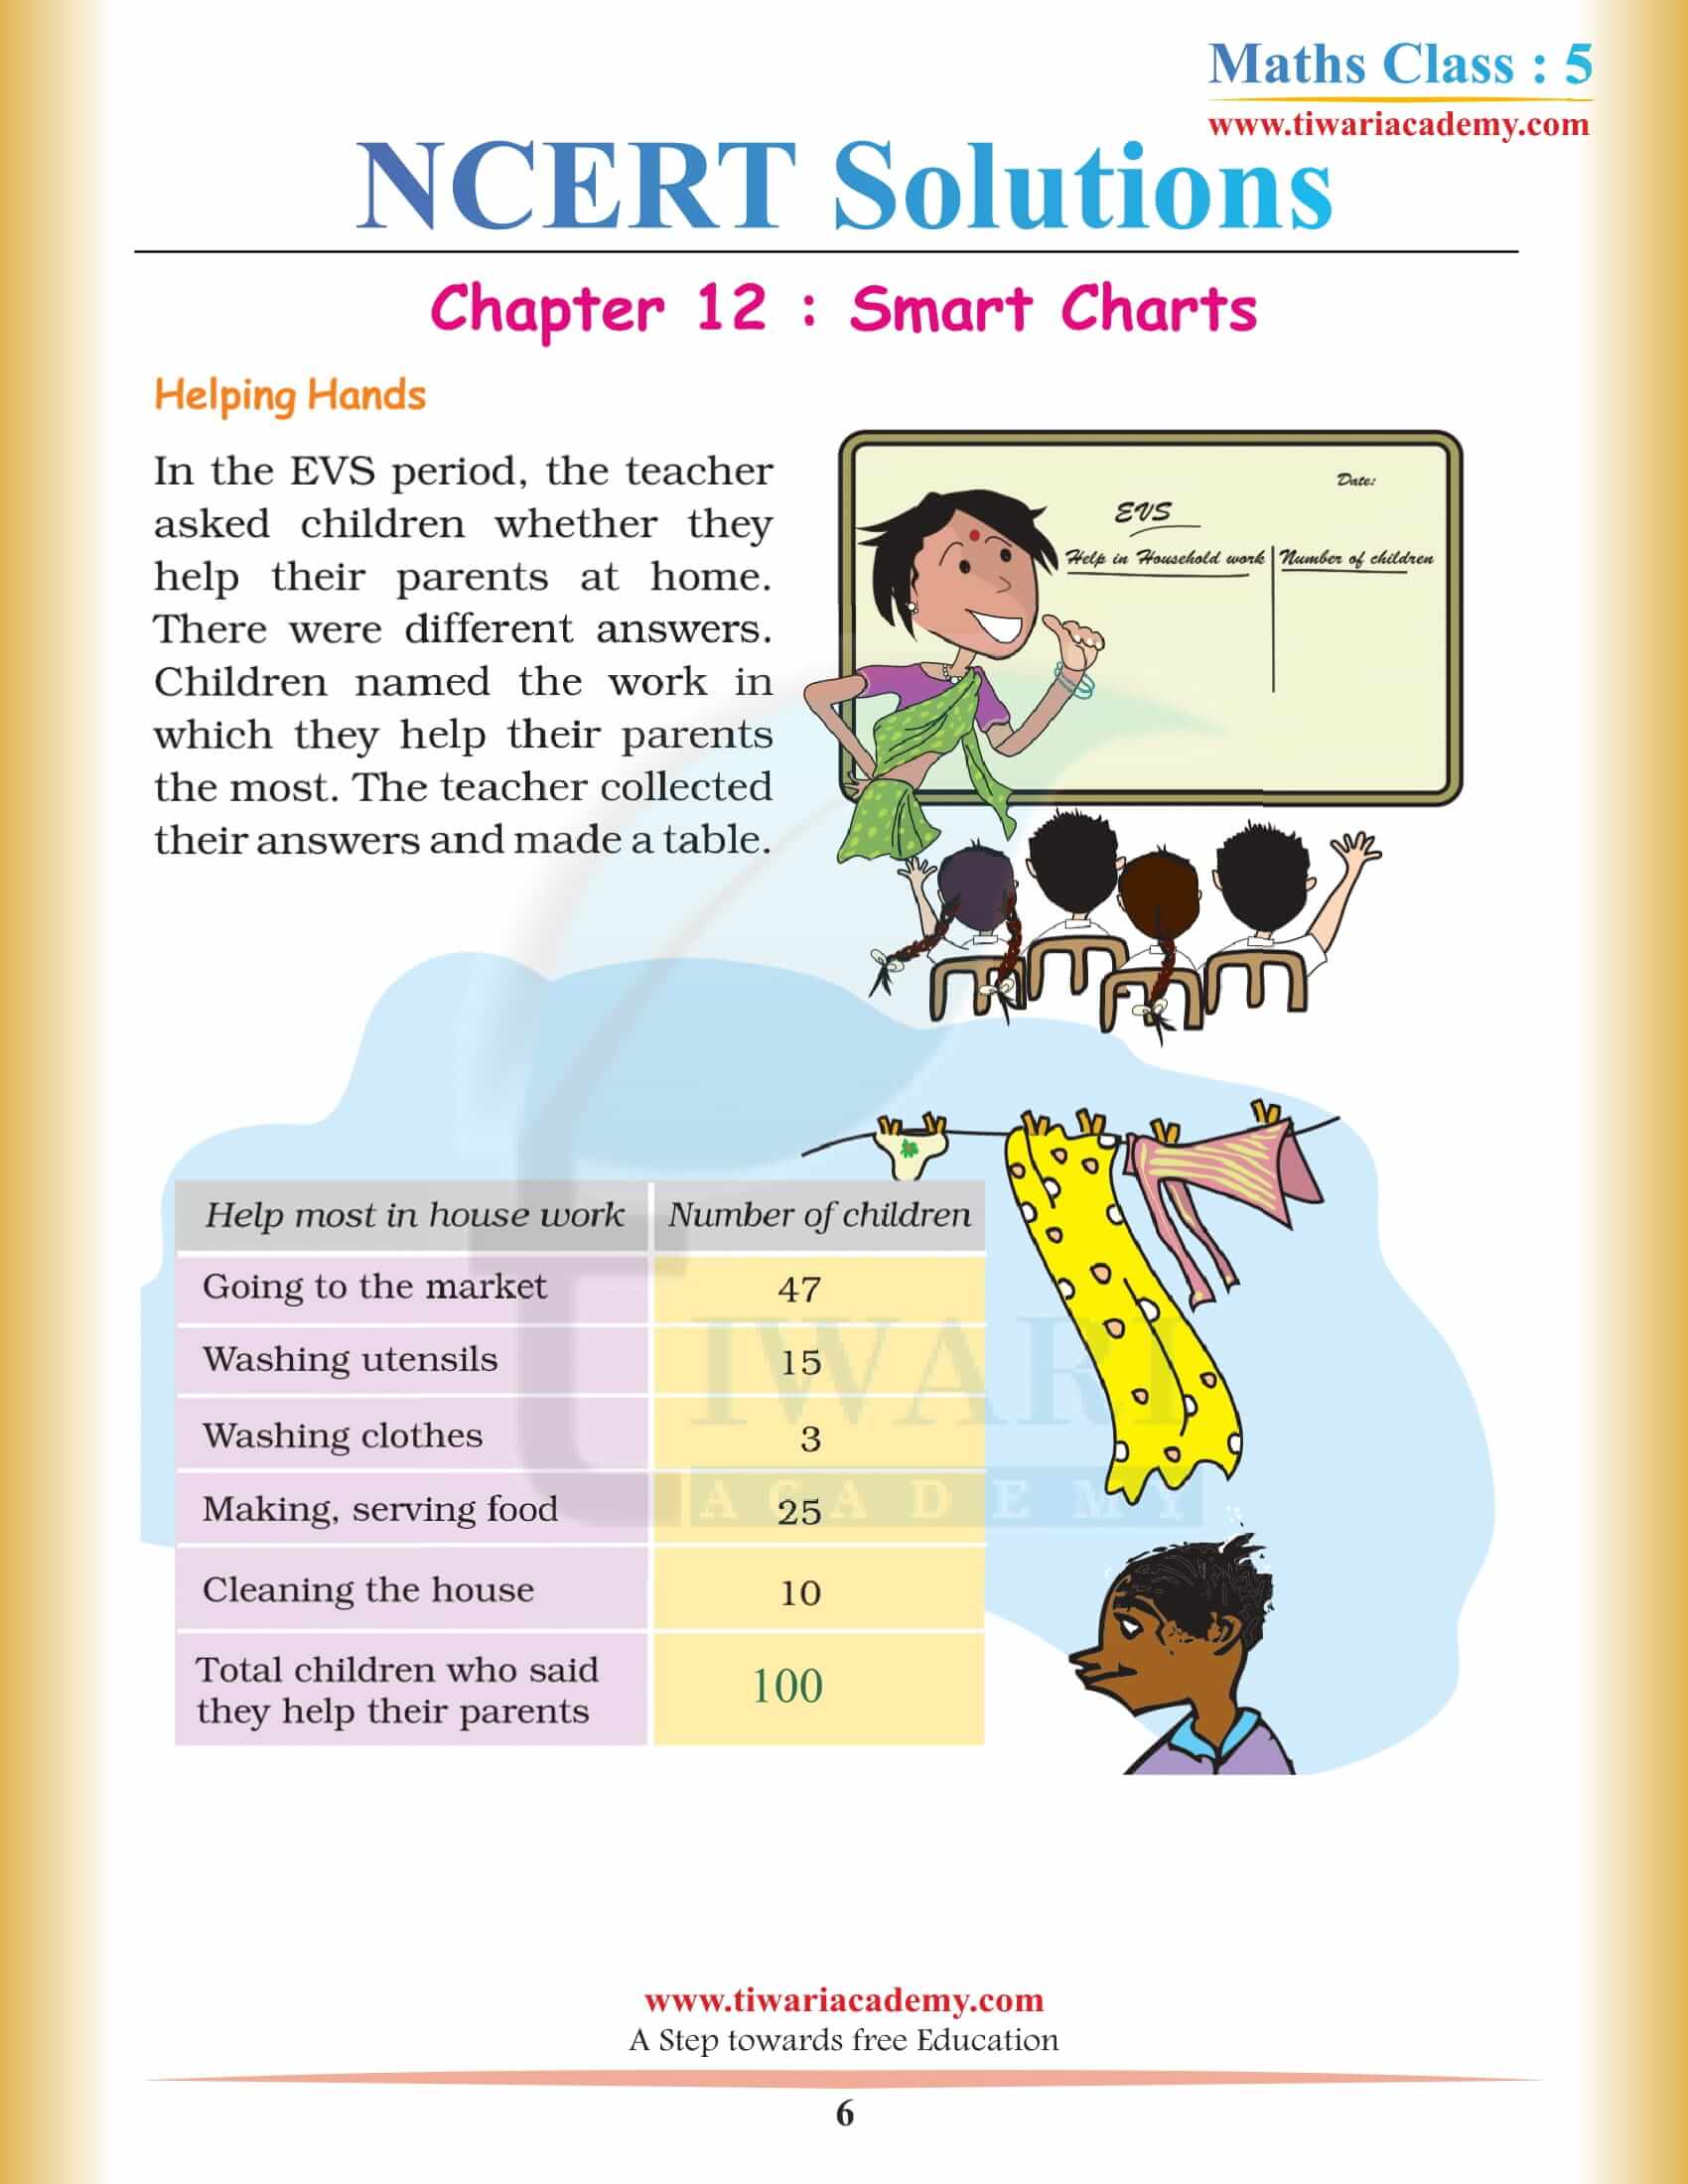
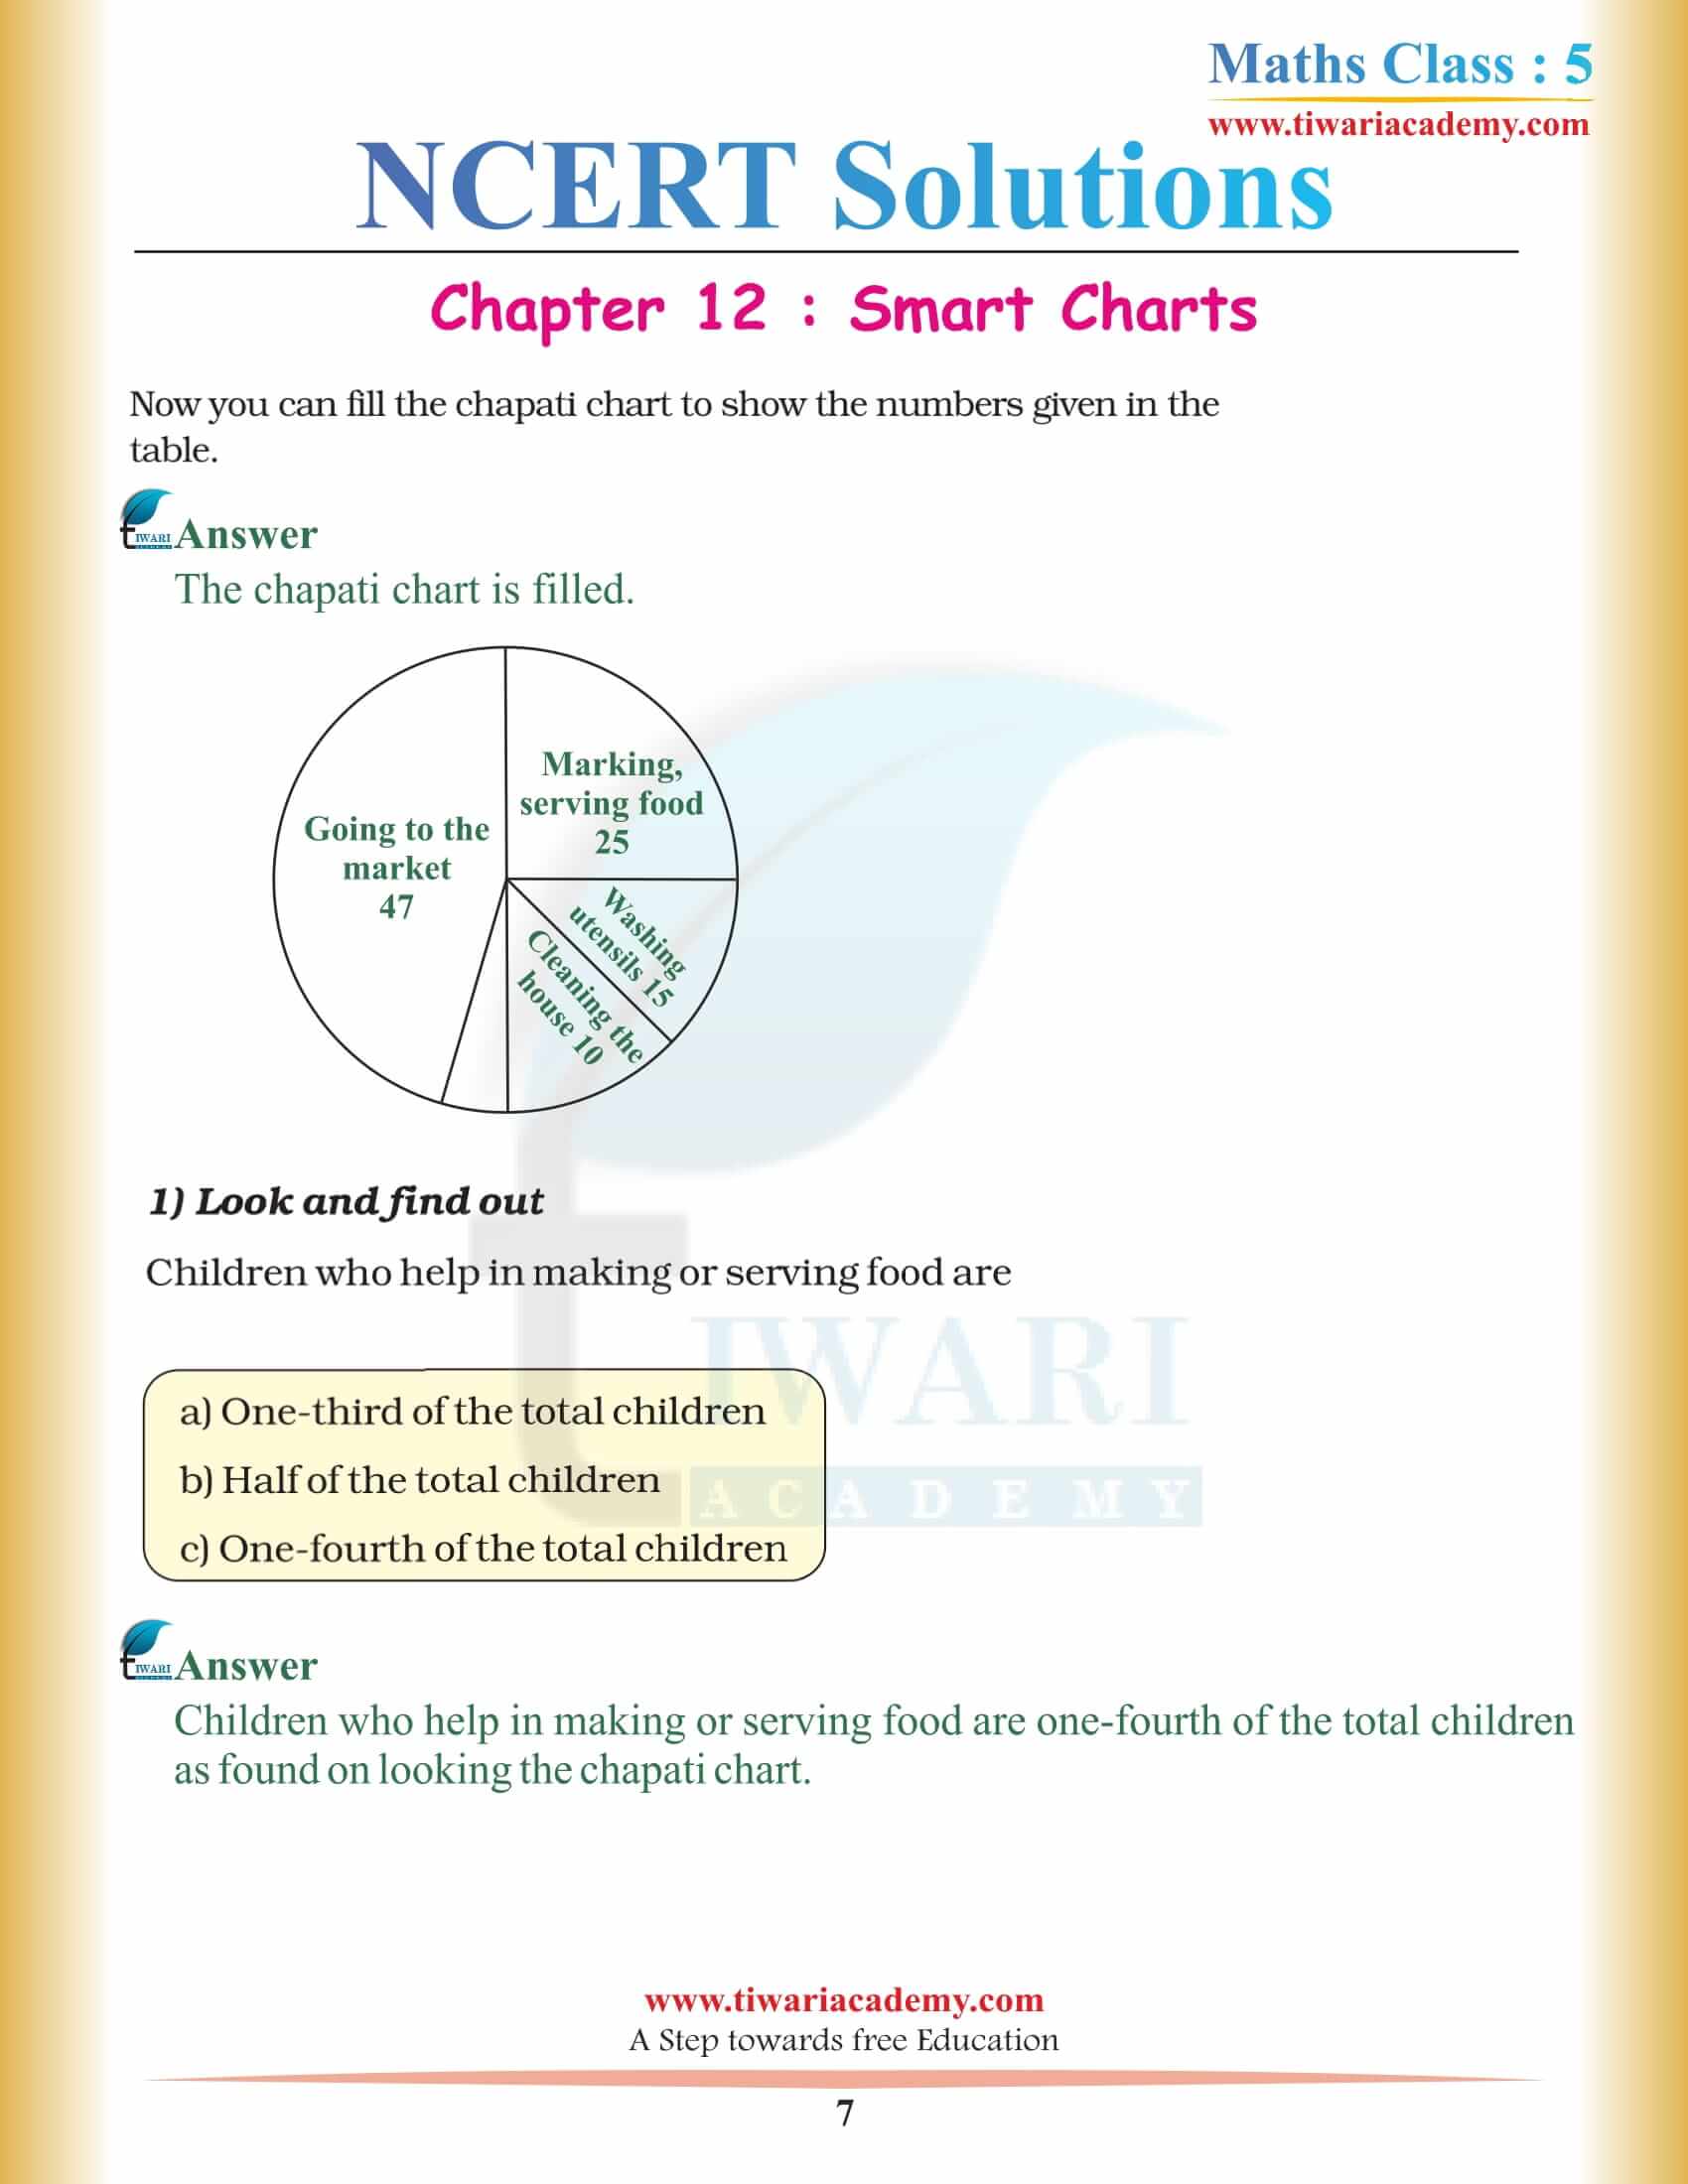
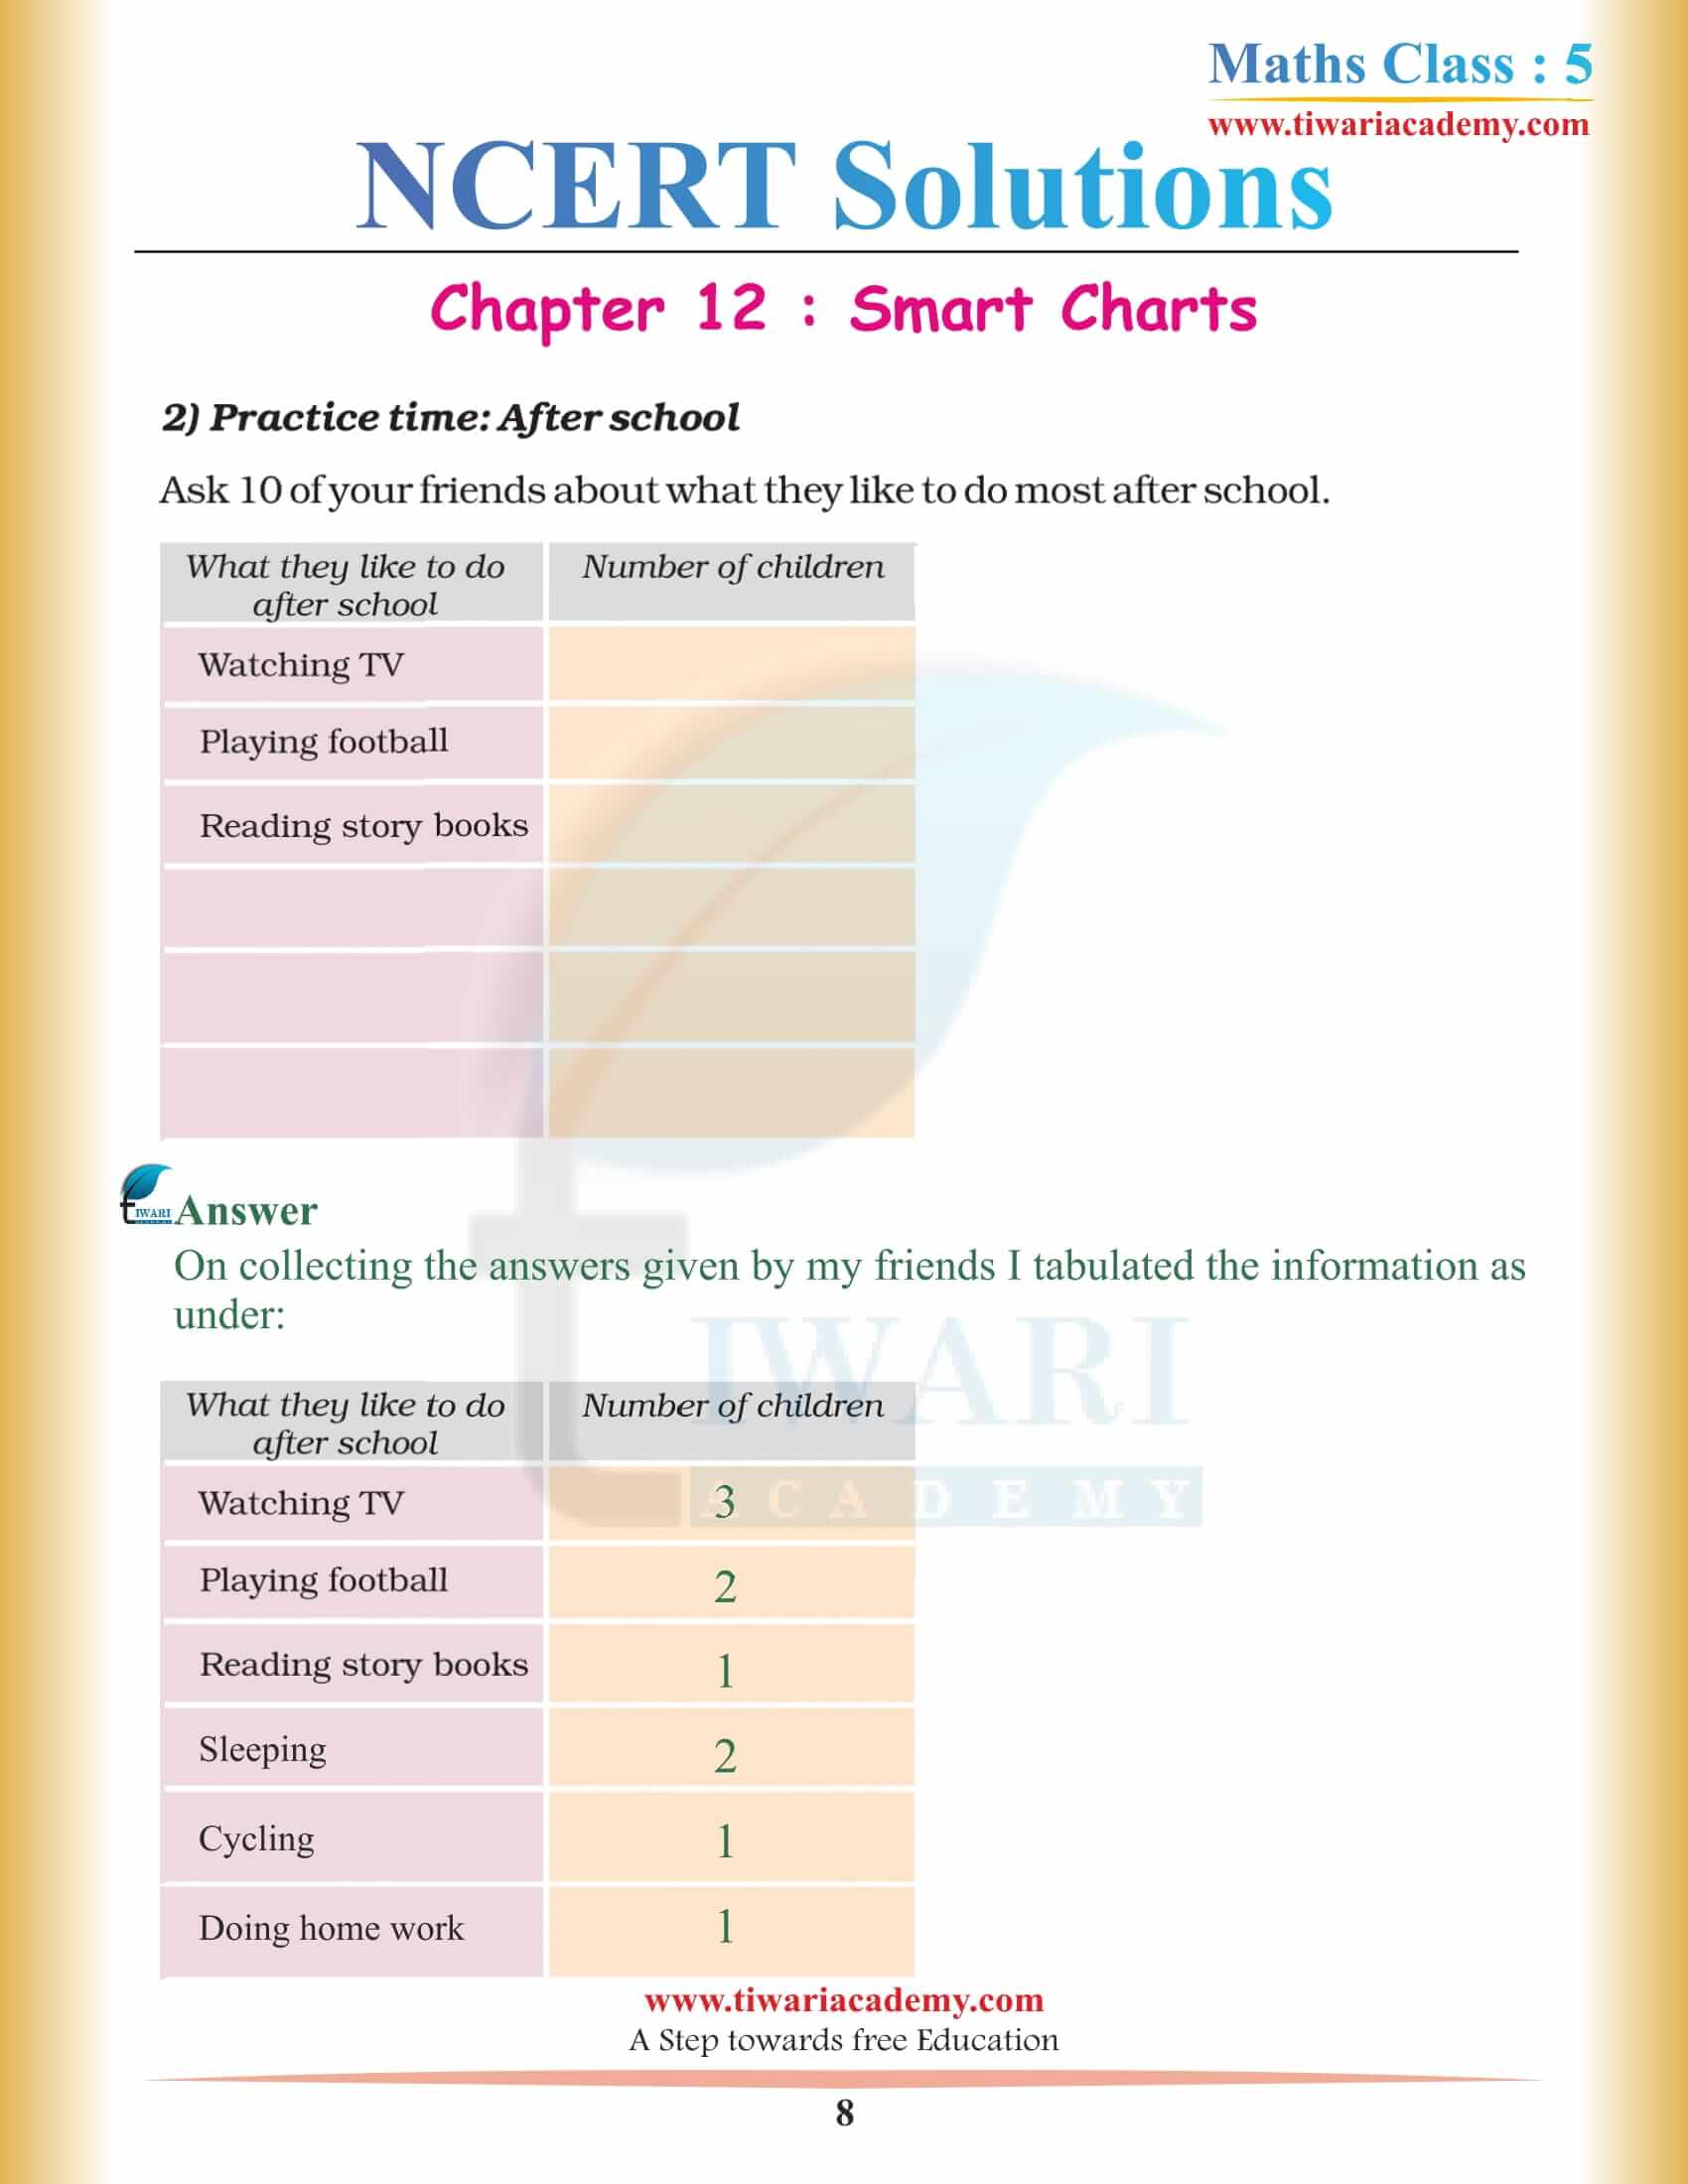
These numbers that you have filled inside the box are called data. You can make the chart and fill it. The data of your study-related work by mentioning how many chapters you have covered so far and how long you have been studying and what are subjects required most of your attention. This will give you a clear idea that how to complete the chapter and at what time. Do you find this confusing?
5th Standard NCERT Maths Chapter 12 Suggestions
I think not, besides you’ve been using this method for a long time now in your school that is called Time Table. Which shows you at what time your favorite teacher will come to teach you and at what time the recess will be on.
This is the same way you have to make a chart but make sure you are not going to make this type of data for yourself because unlike others you are creative and you can make the data chart look beautiful and yet understanding for you and for others who can see the data or your smart chart.
Do these smart charts in Chapter 12 of class 5th mathematics provide the same information as the previous one?
In the NCERT book of mathematics class, 5th students will be able to explore new topics in every chapter, and not only that they will be able to use the information and skill that they had learned in the previous chapter too. These smart charts are one of the topics that give that same information along with using the previous ones.
What are the topics did you find more interesting in chapter 12 of class 5th Maths?
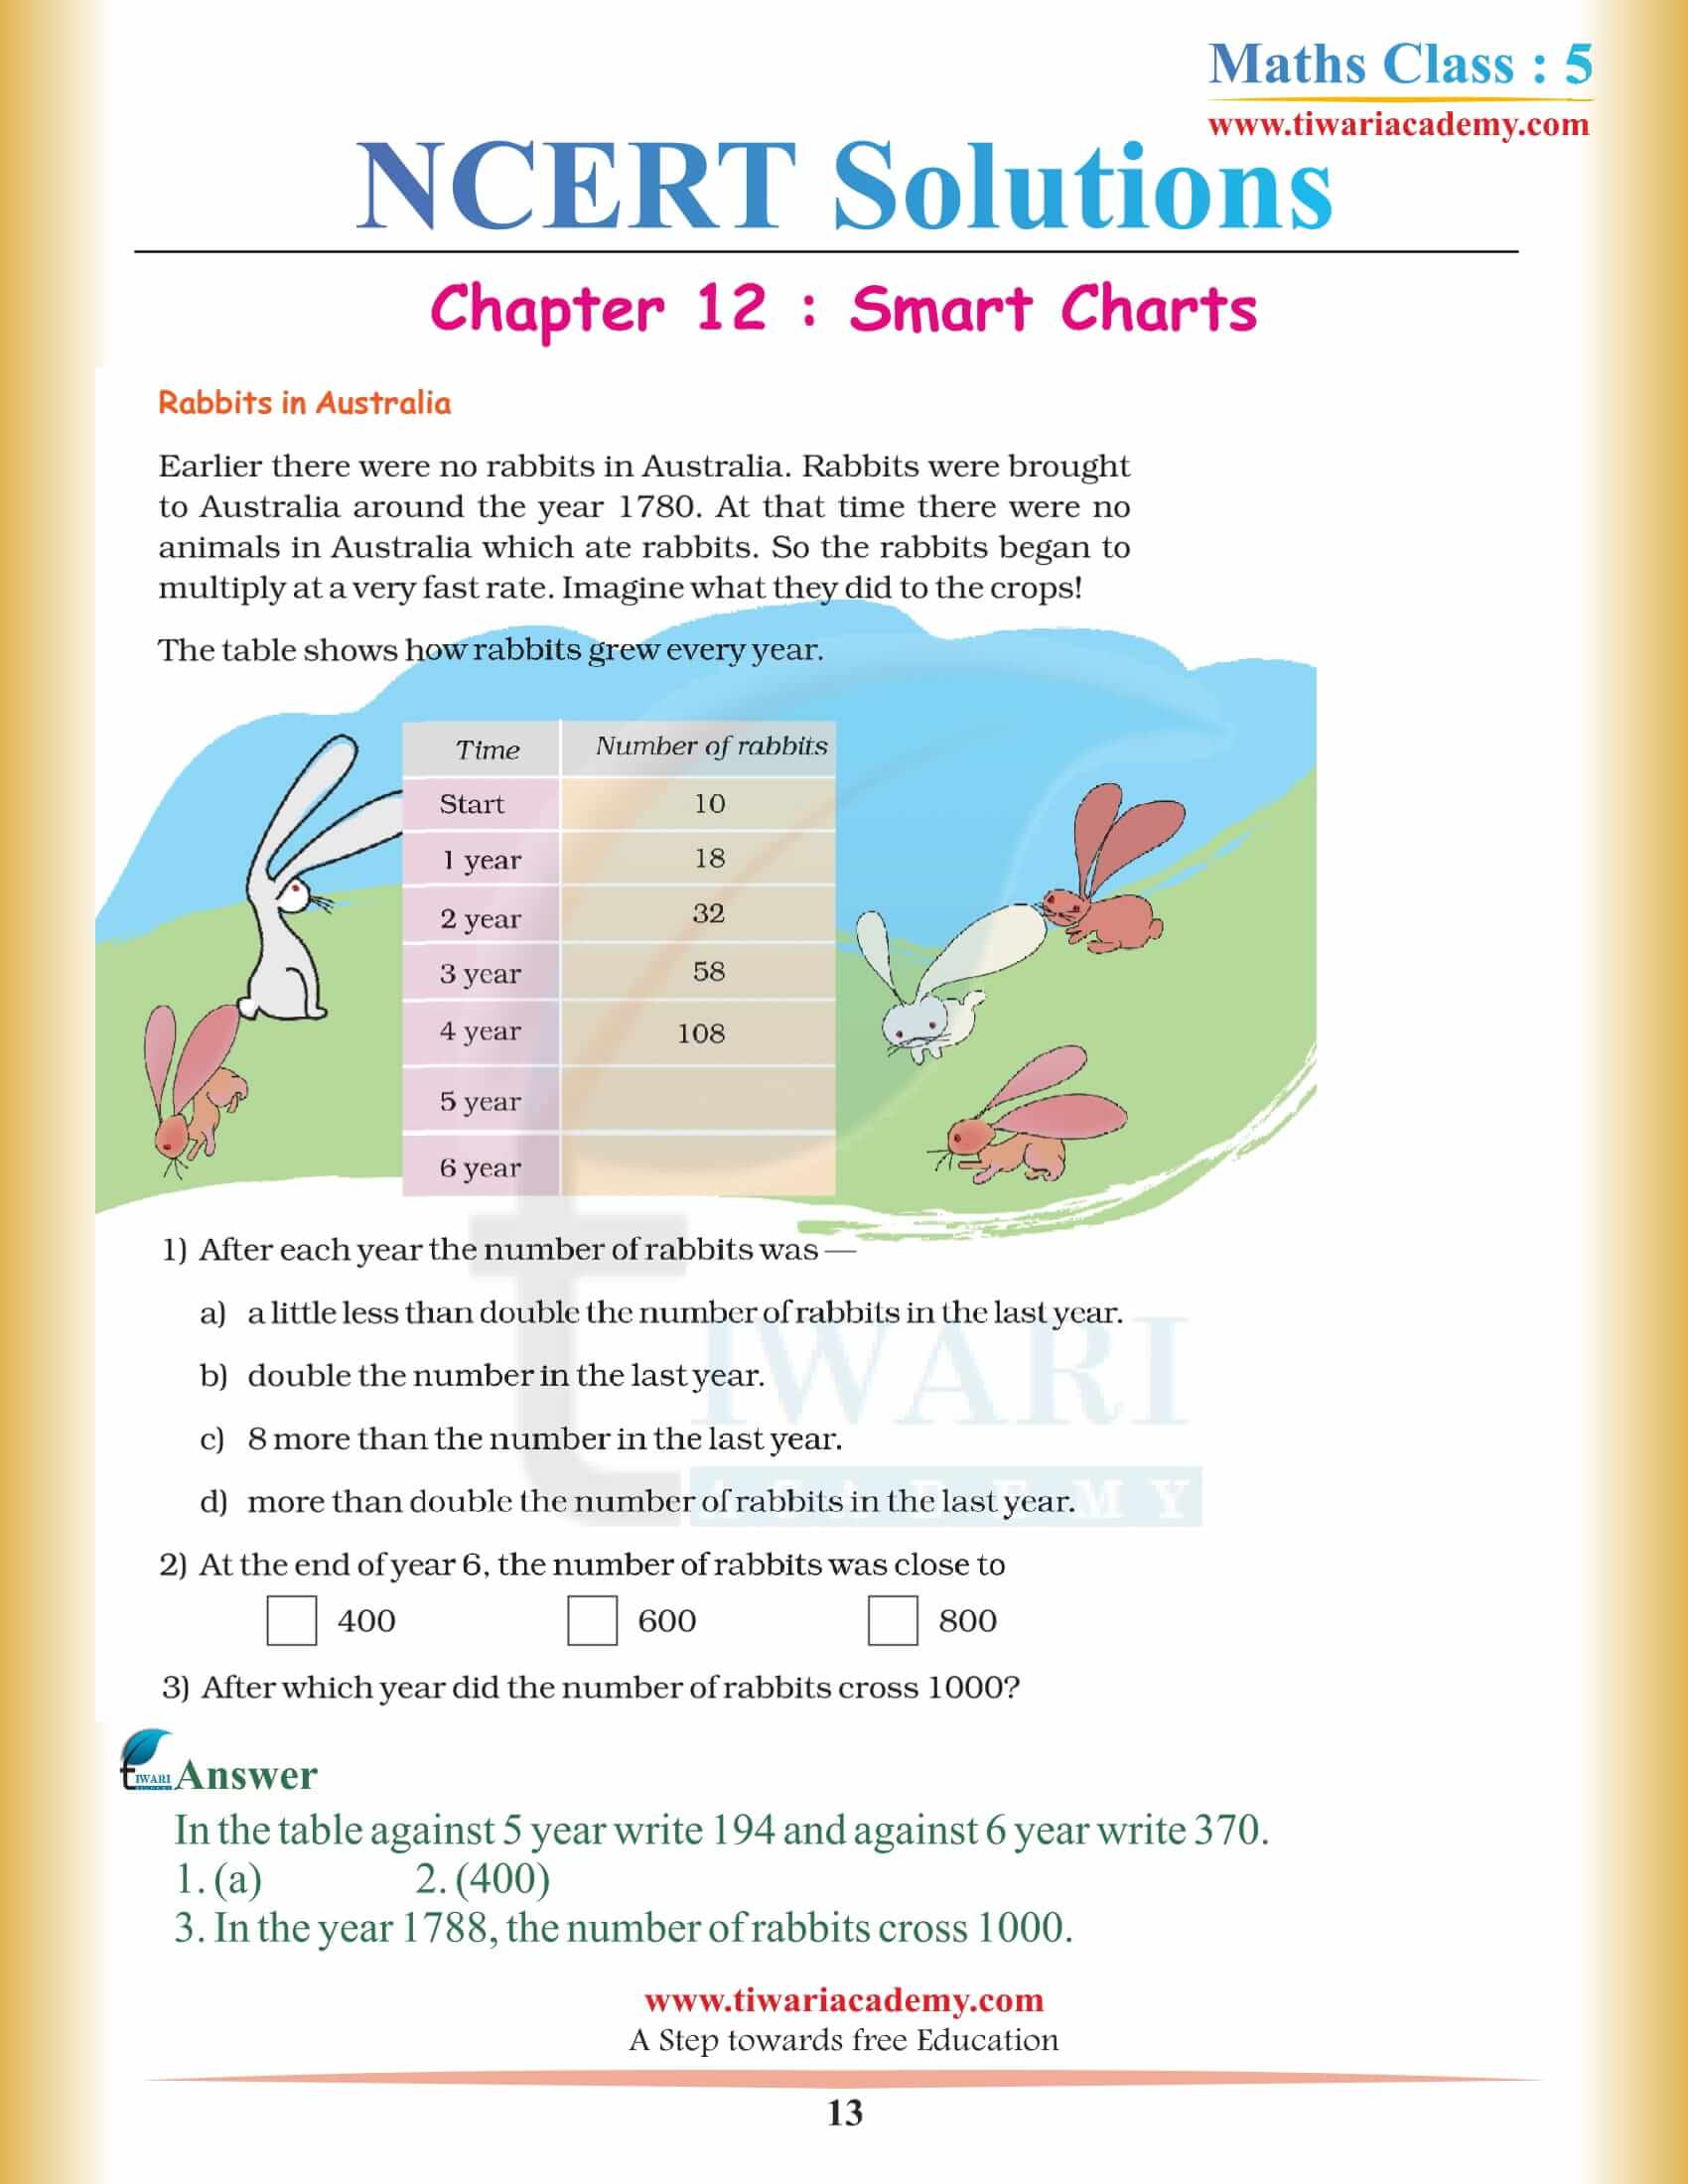
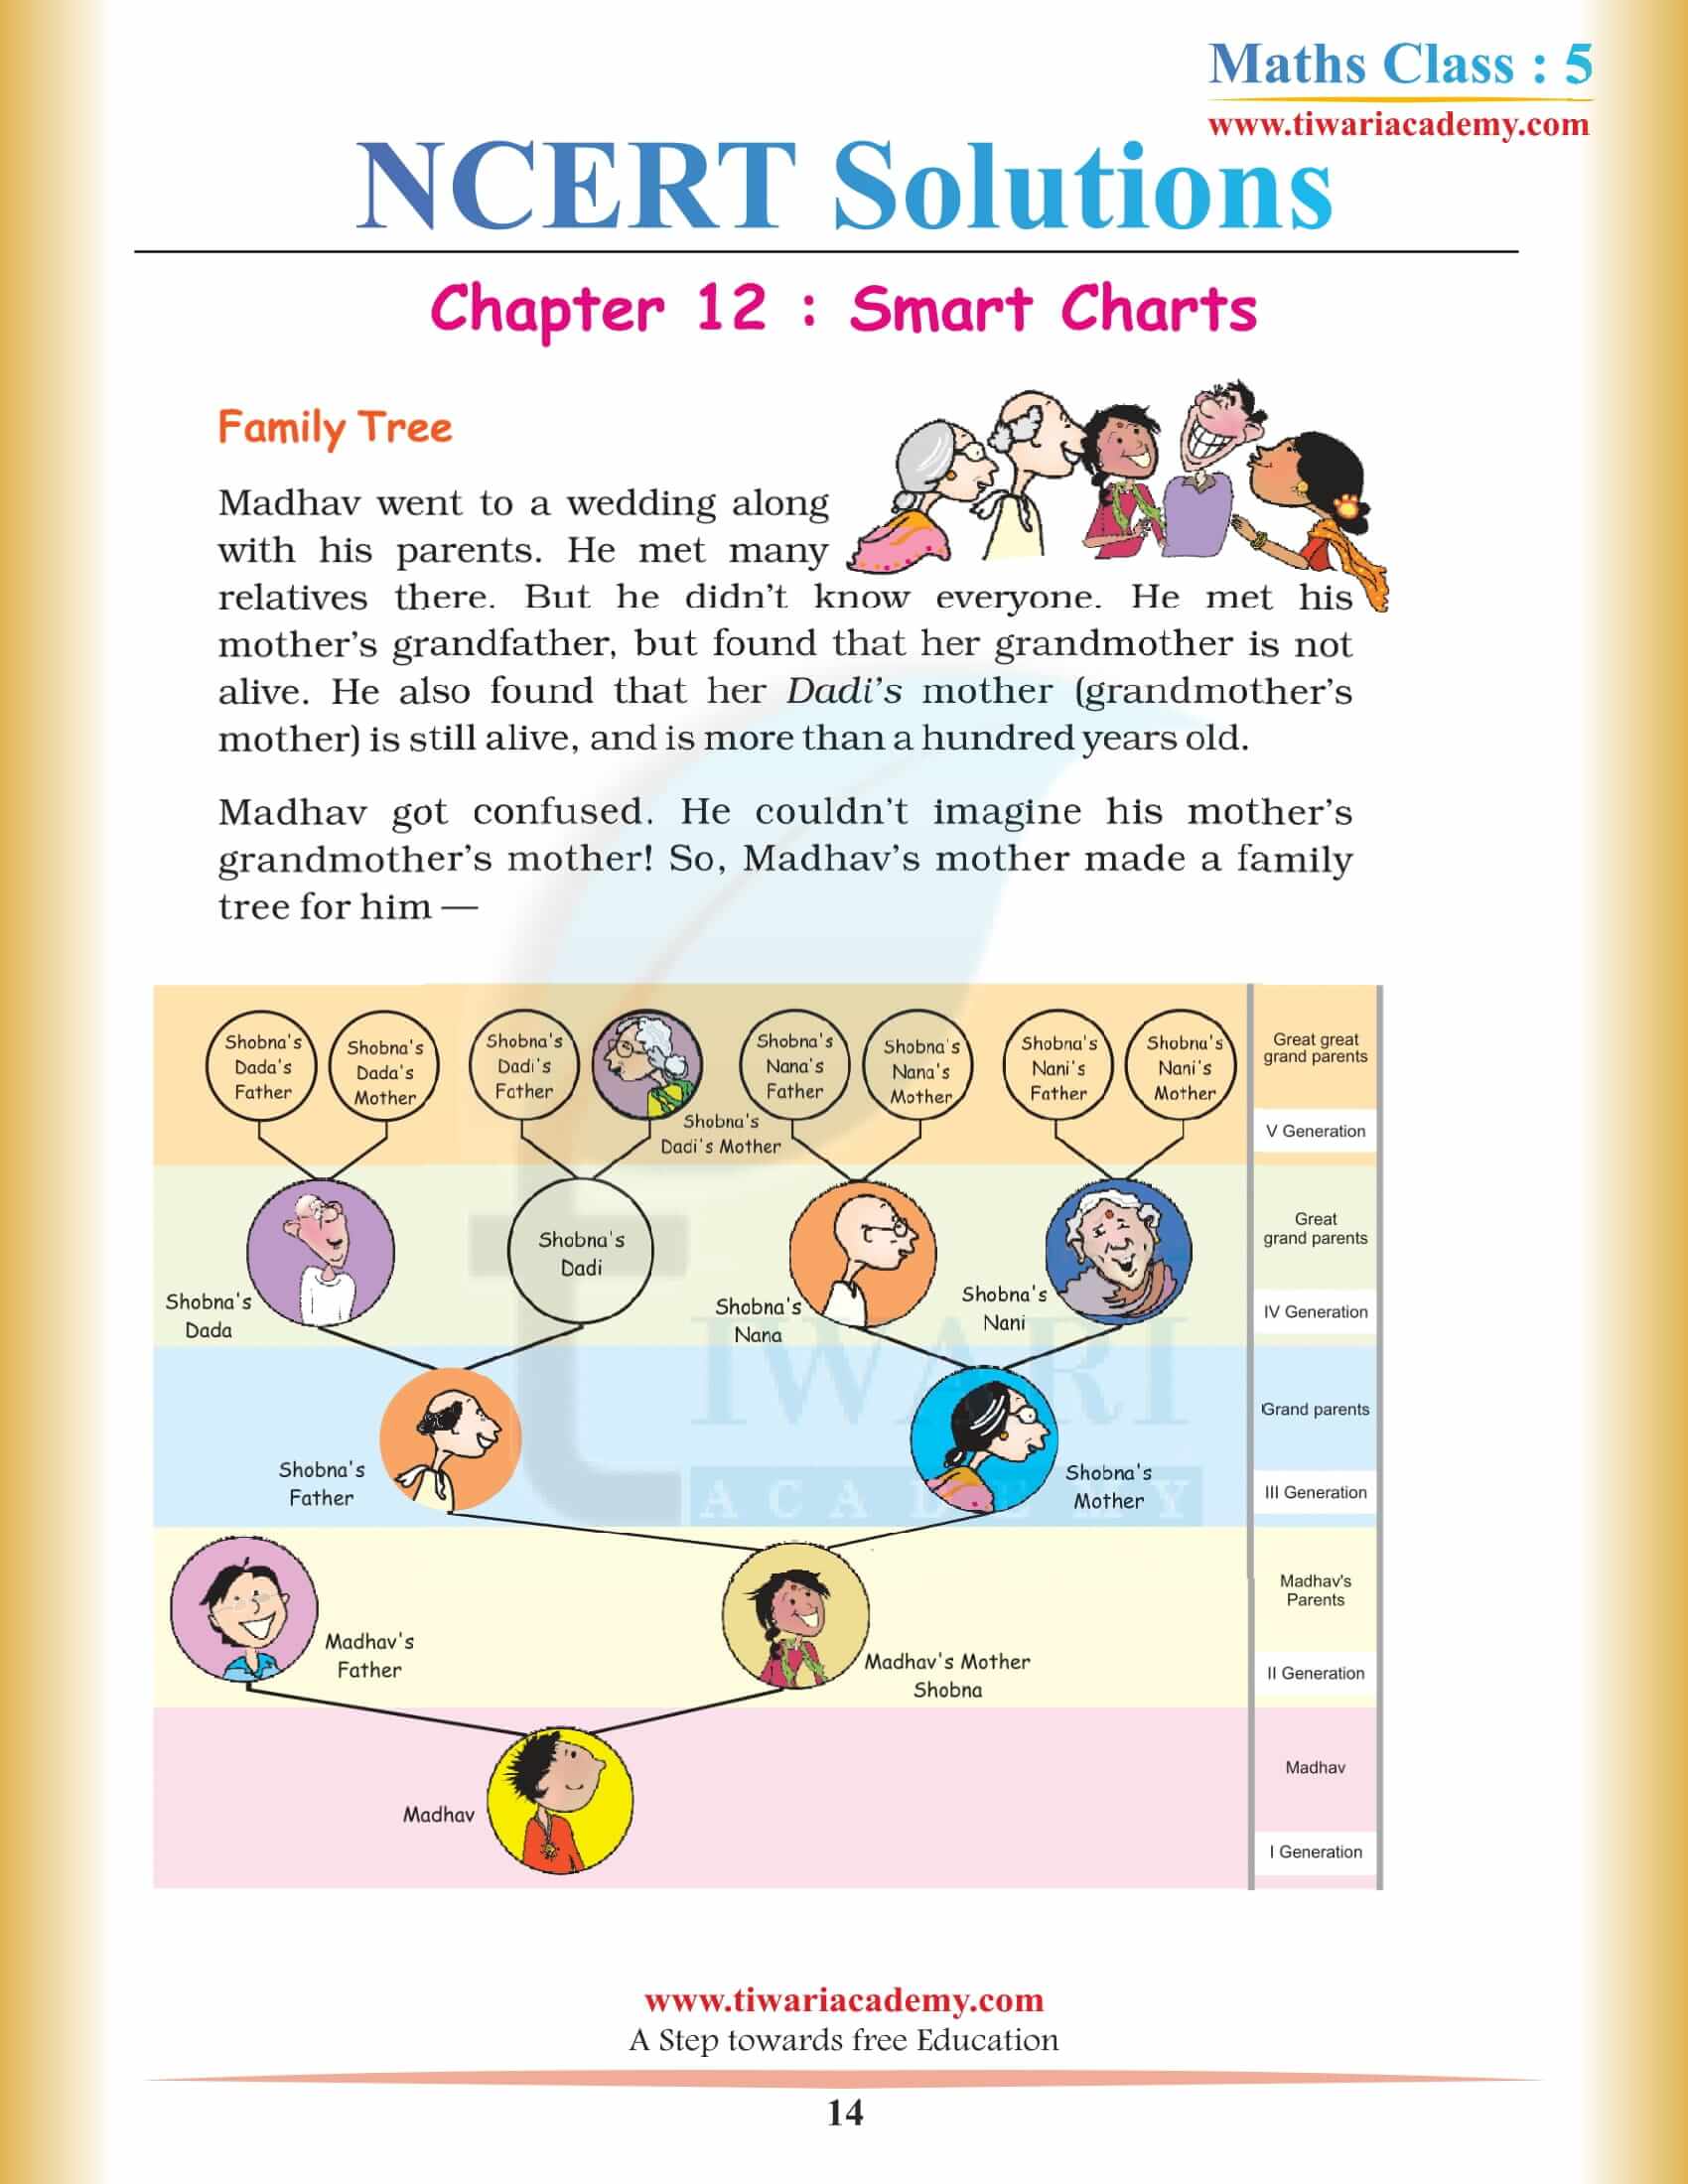
I think there are lots of different topics that contain information that students can use to prepare smart charts. Though I like the “rabbit in Australia” and “Family Tree” more interesting as one can for sure will be able to find out about their own family and ancestors if they practice it at home.
Did you find chapter 12 easy for class 5th mathematics students?
I found the topics given in the chapter fairly easy to understand. However, that doesn’t make this easy to make because the components one has to enter in charts are could be tricky and time-consuming. However, this sure makes this work more interesting and because once done the maker and readers can get the answers very easily out of it.
