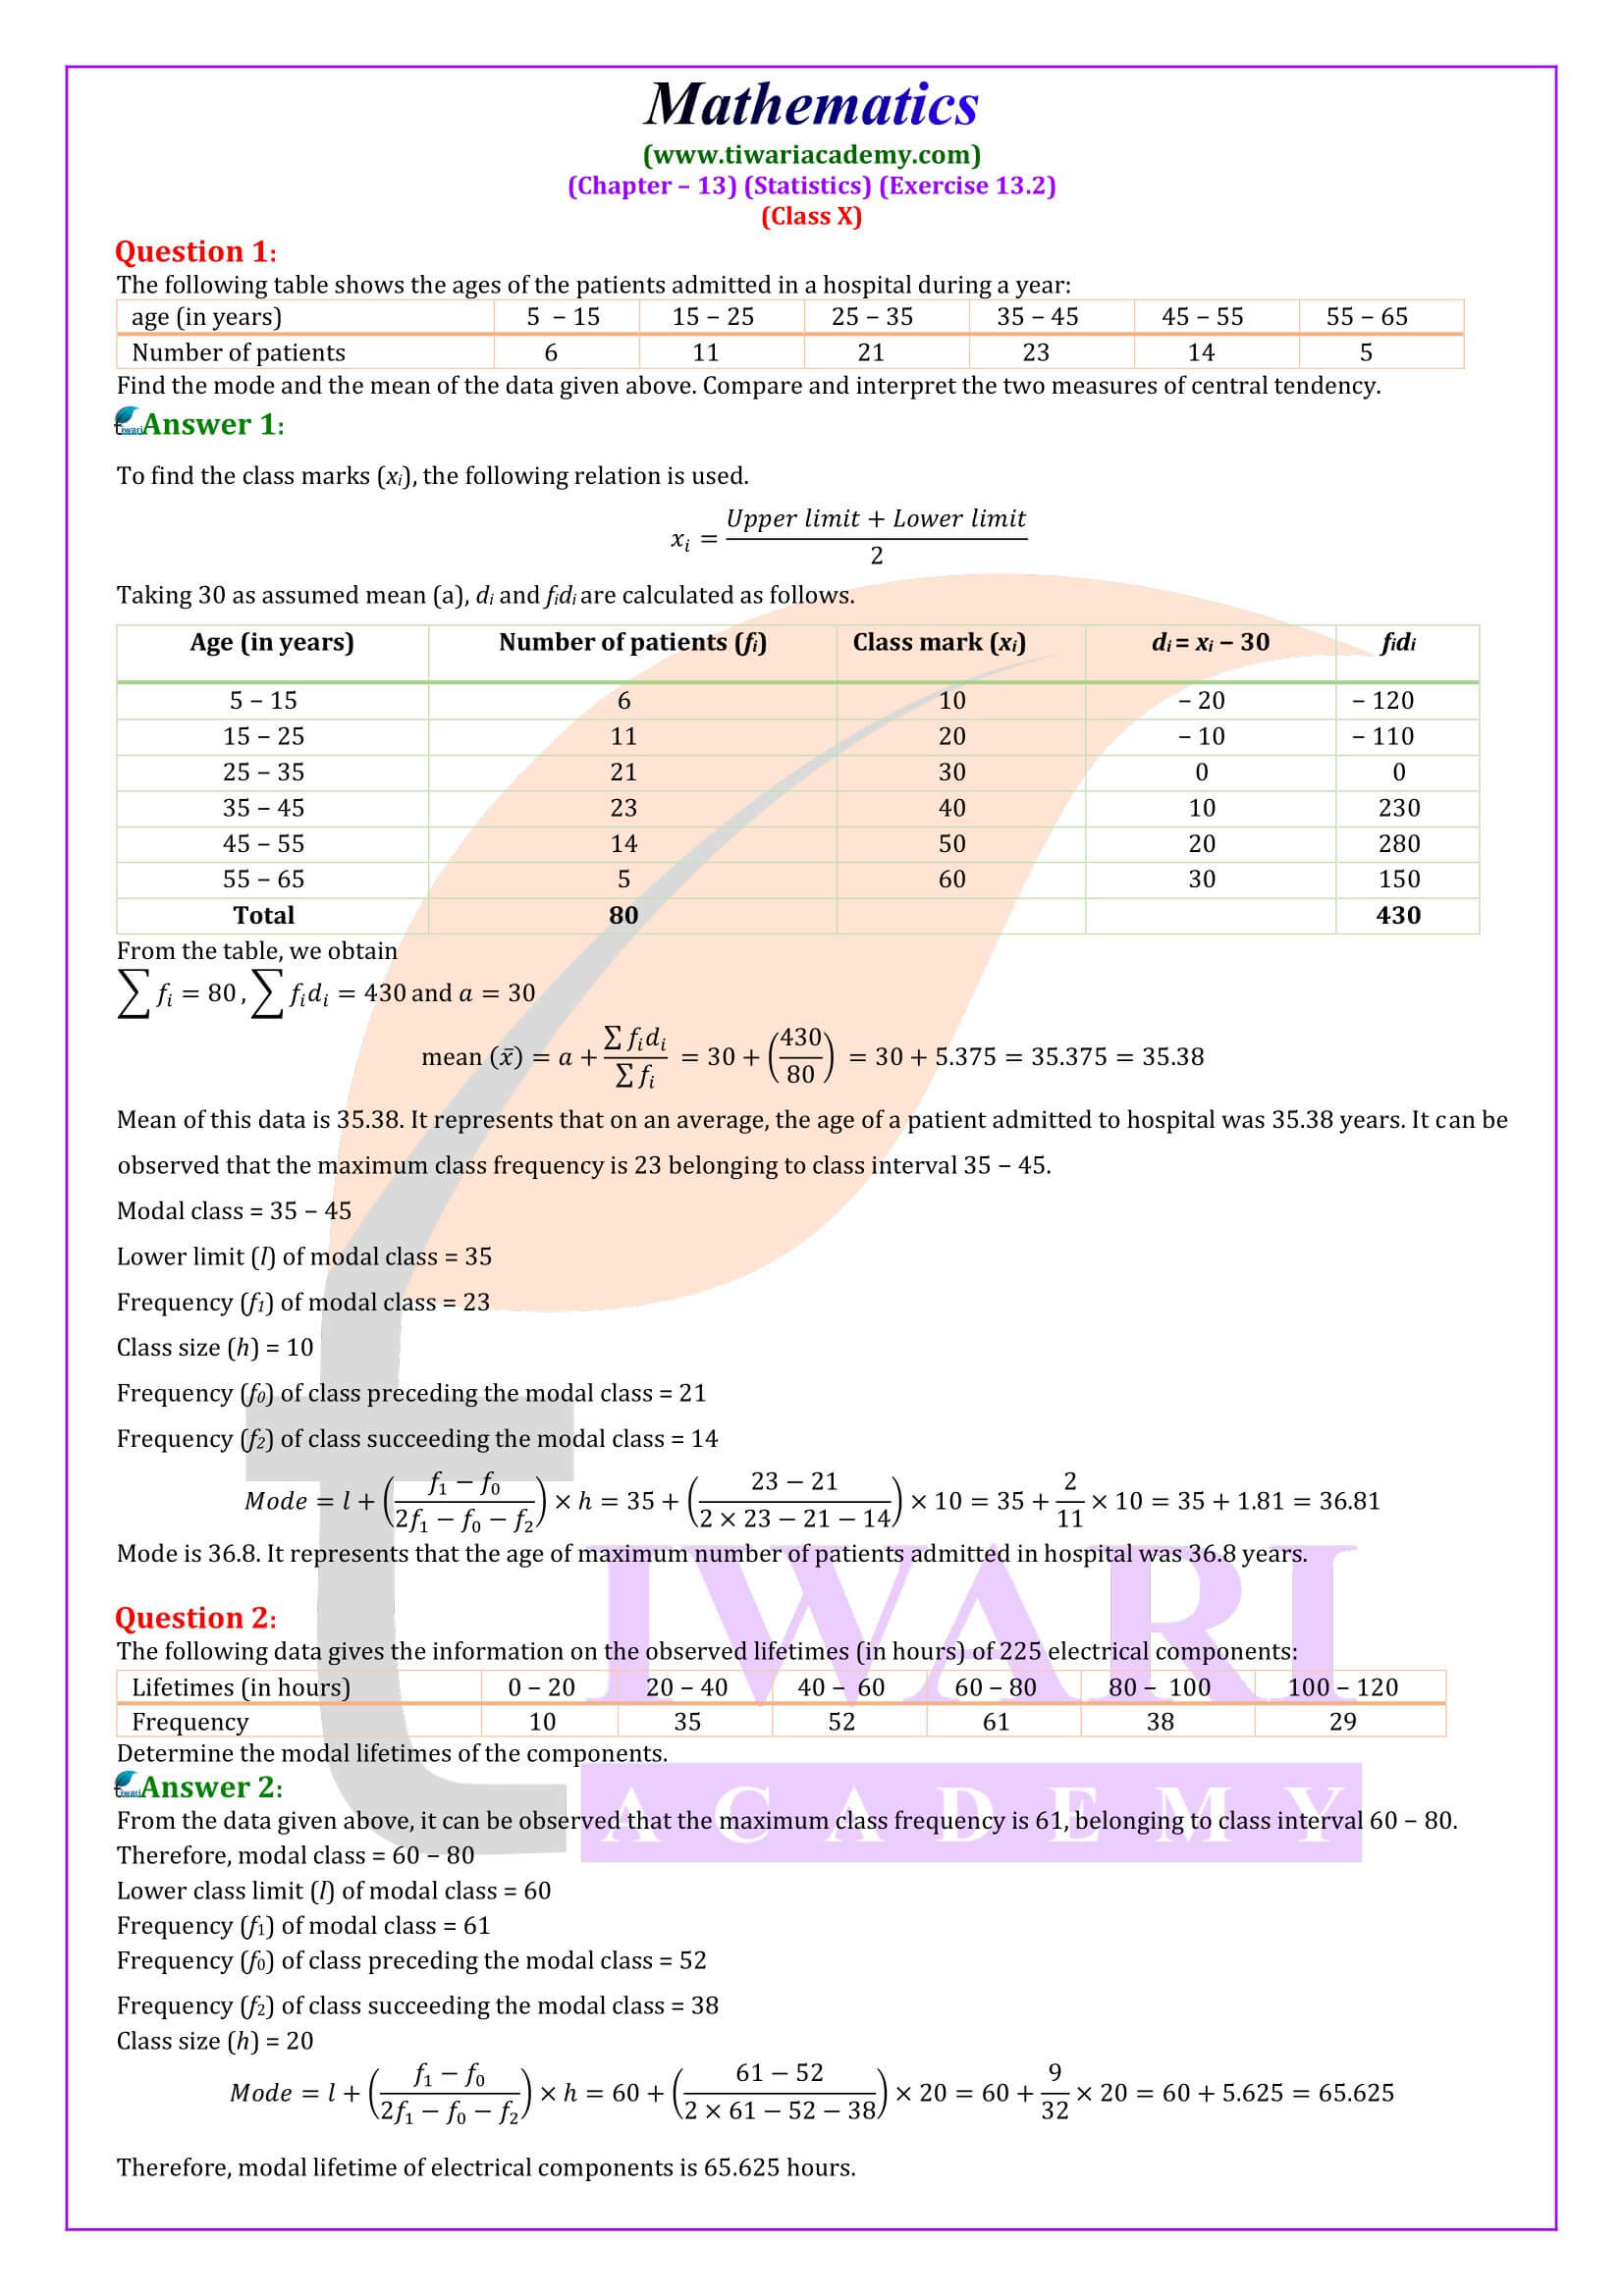
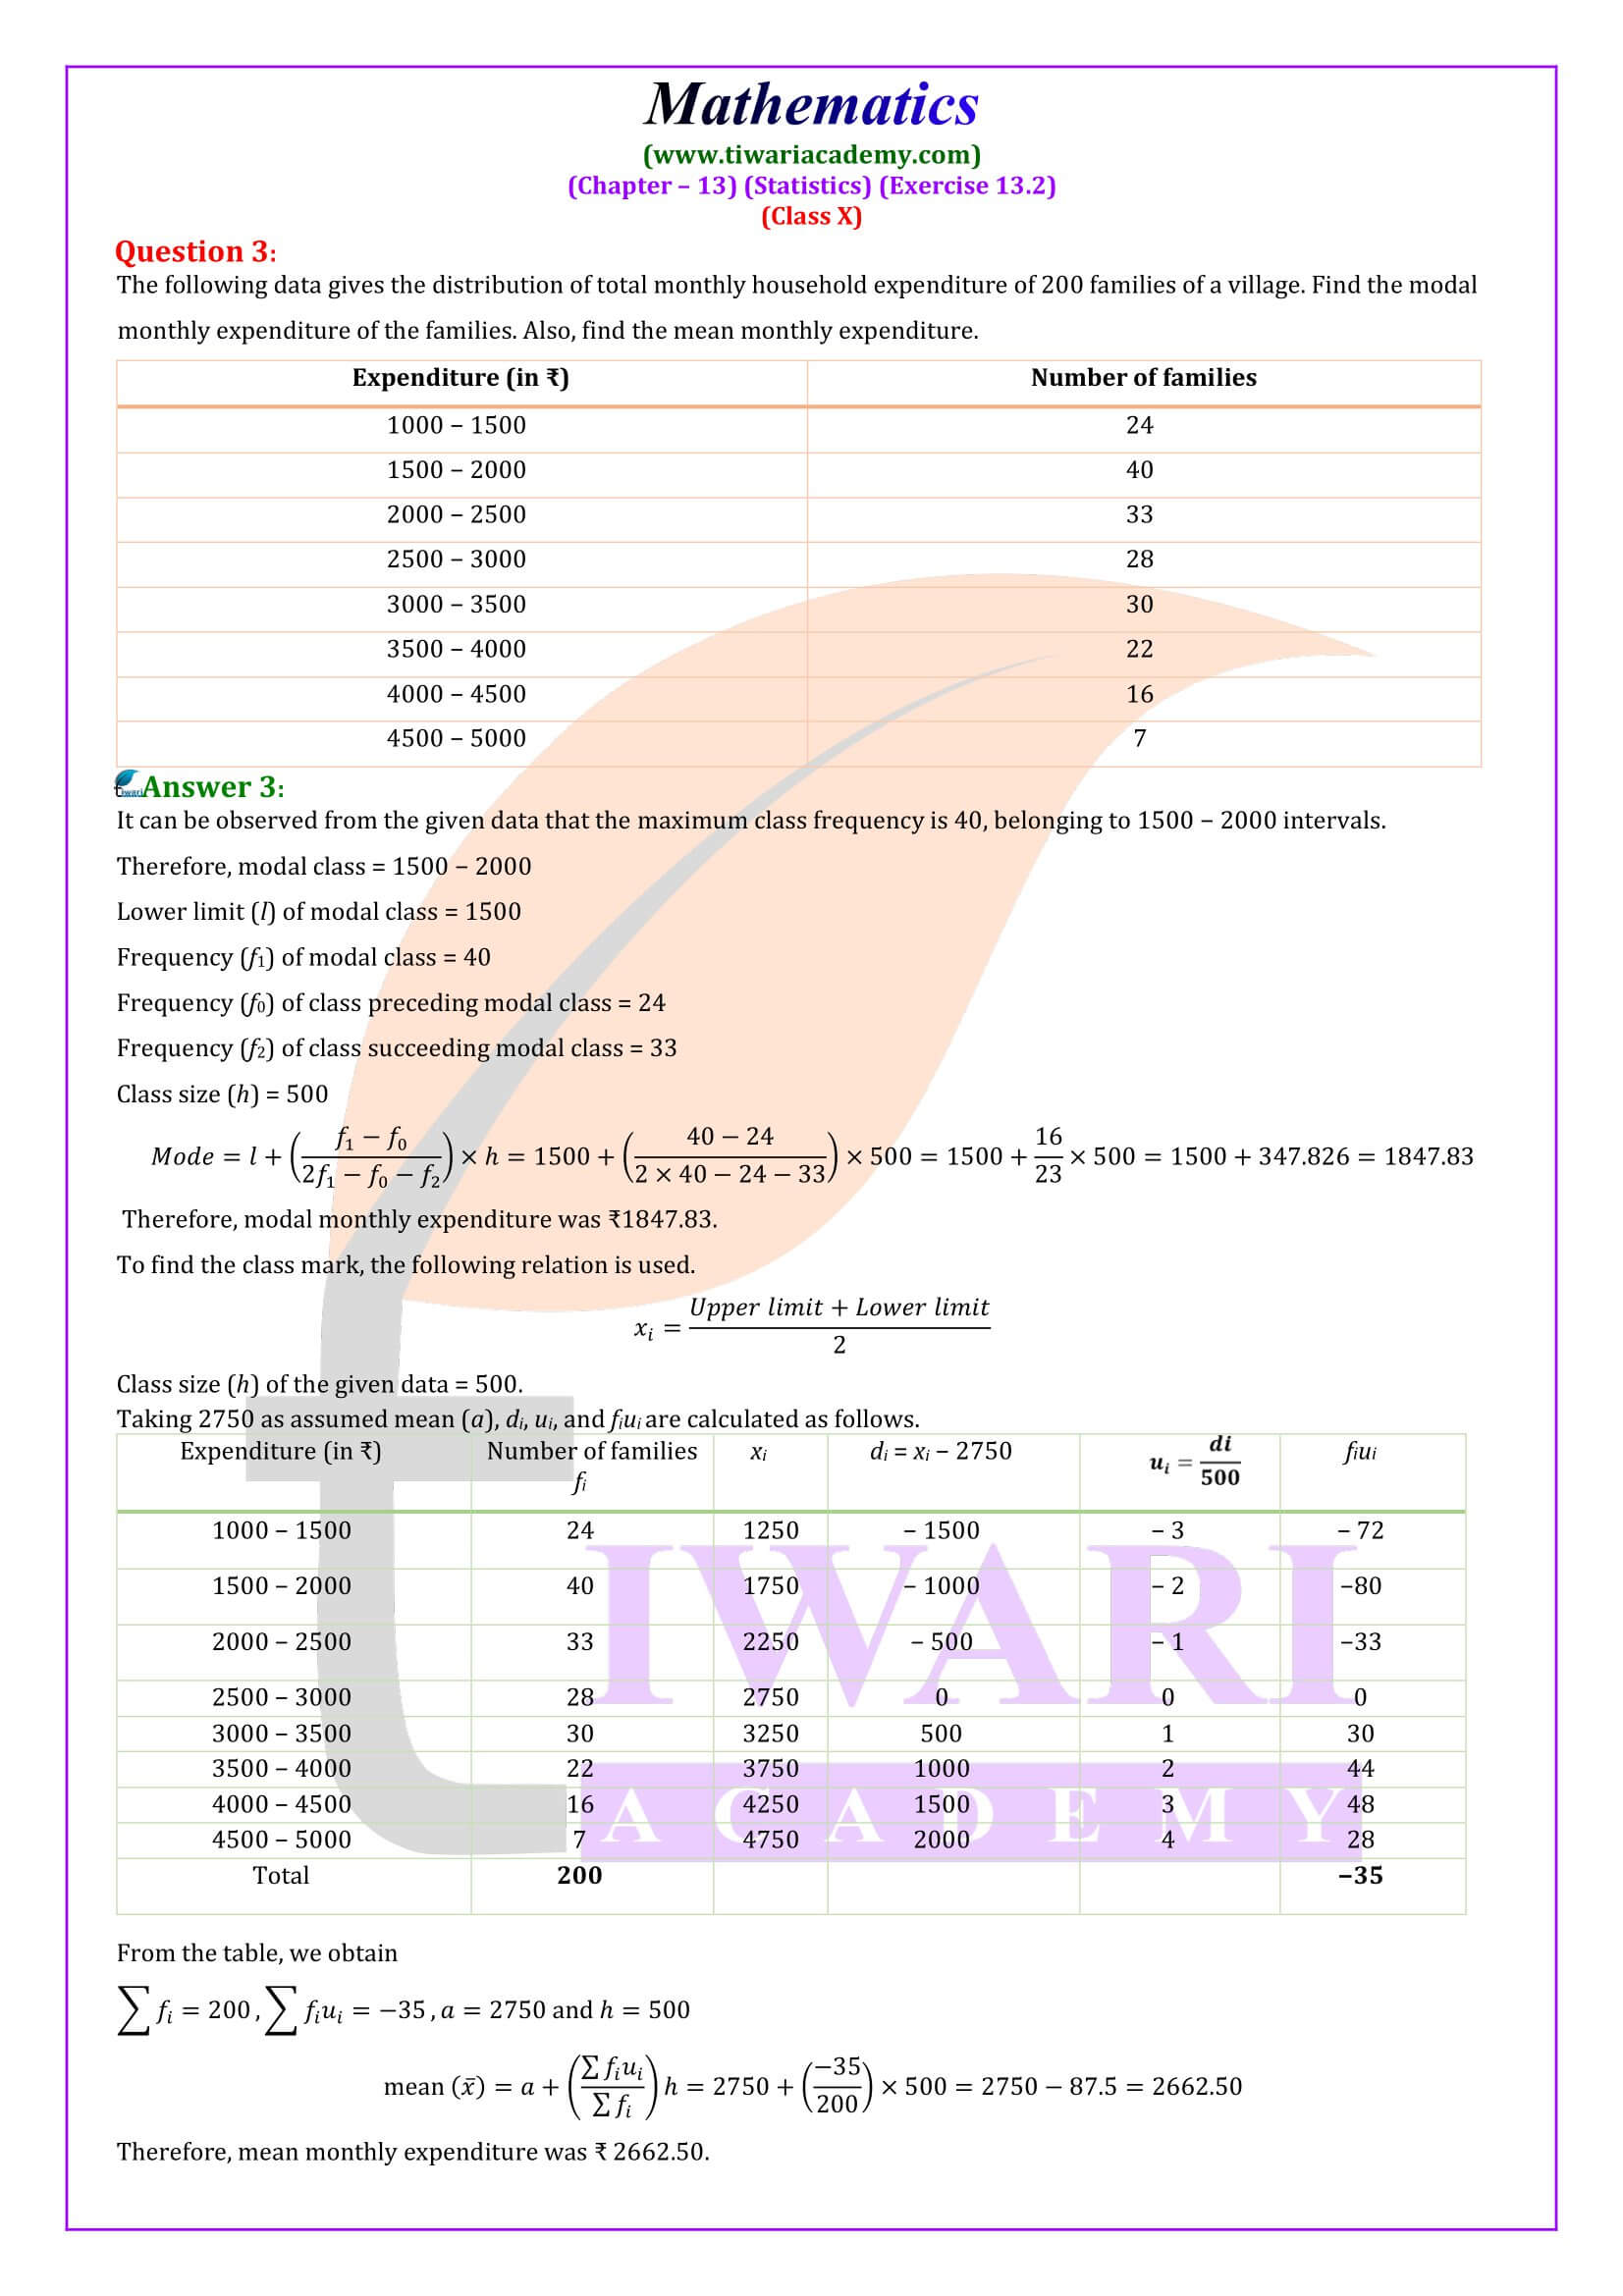
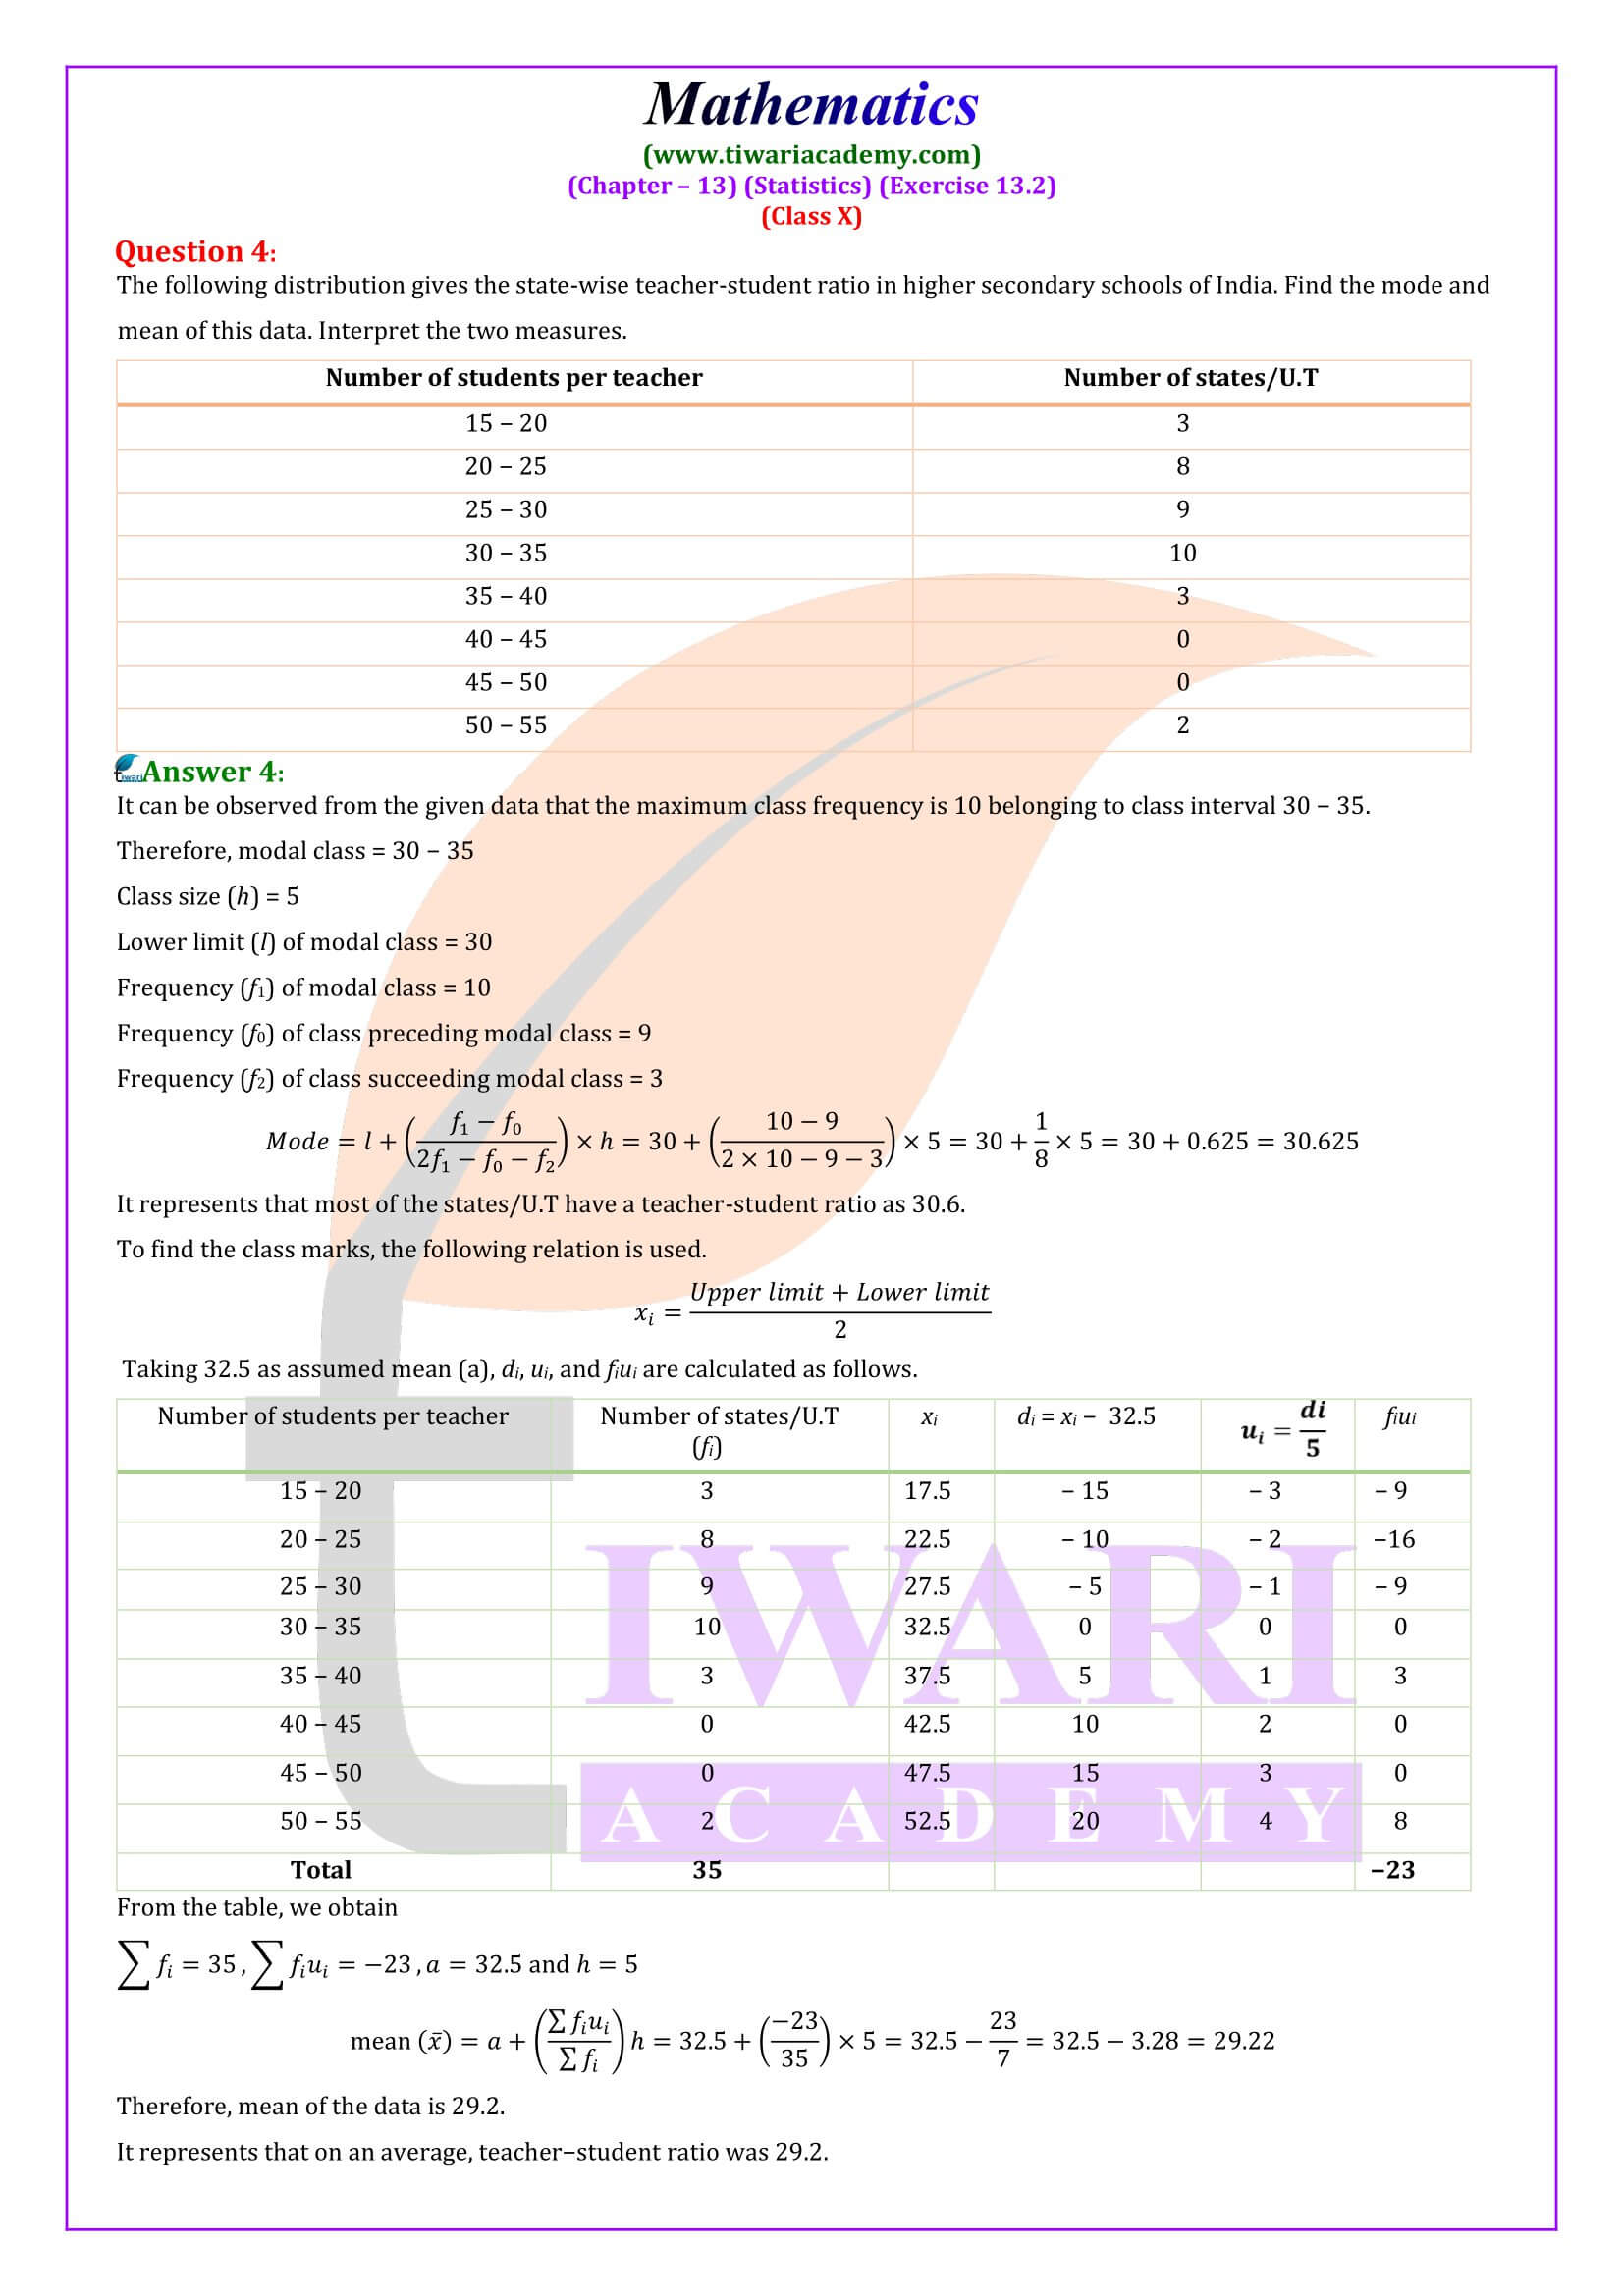
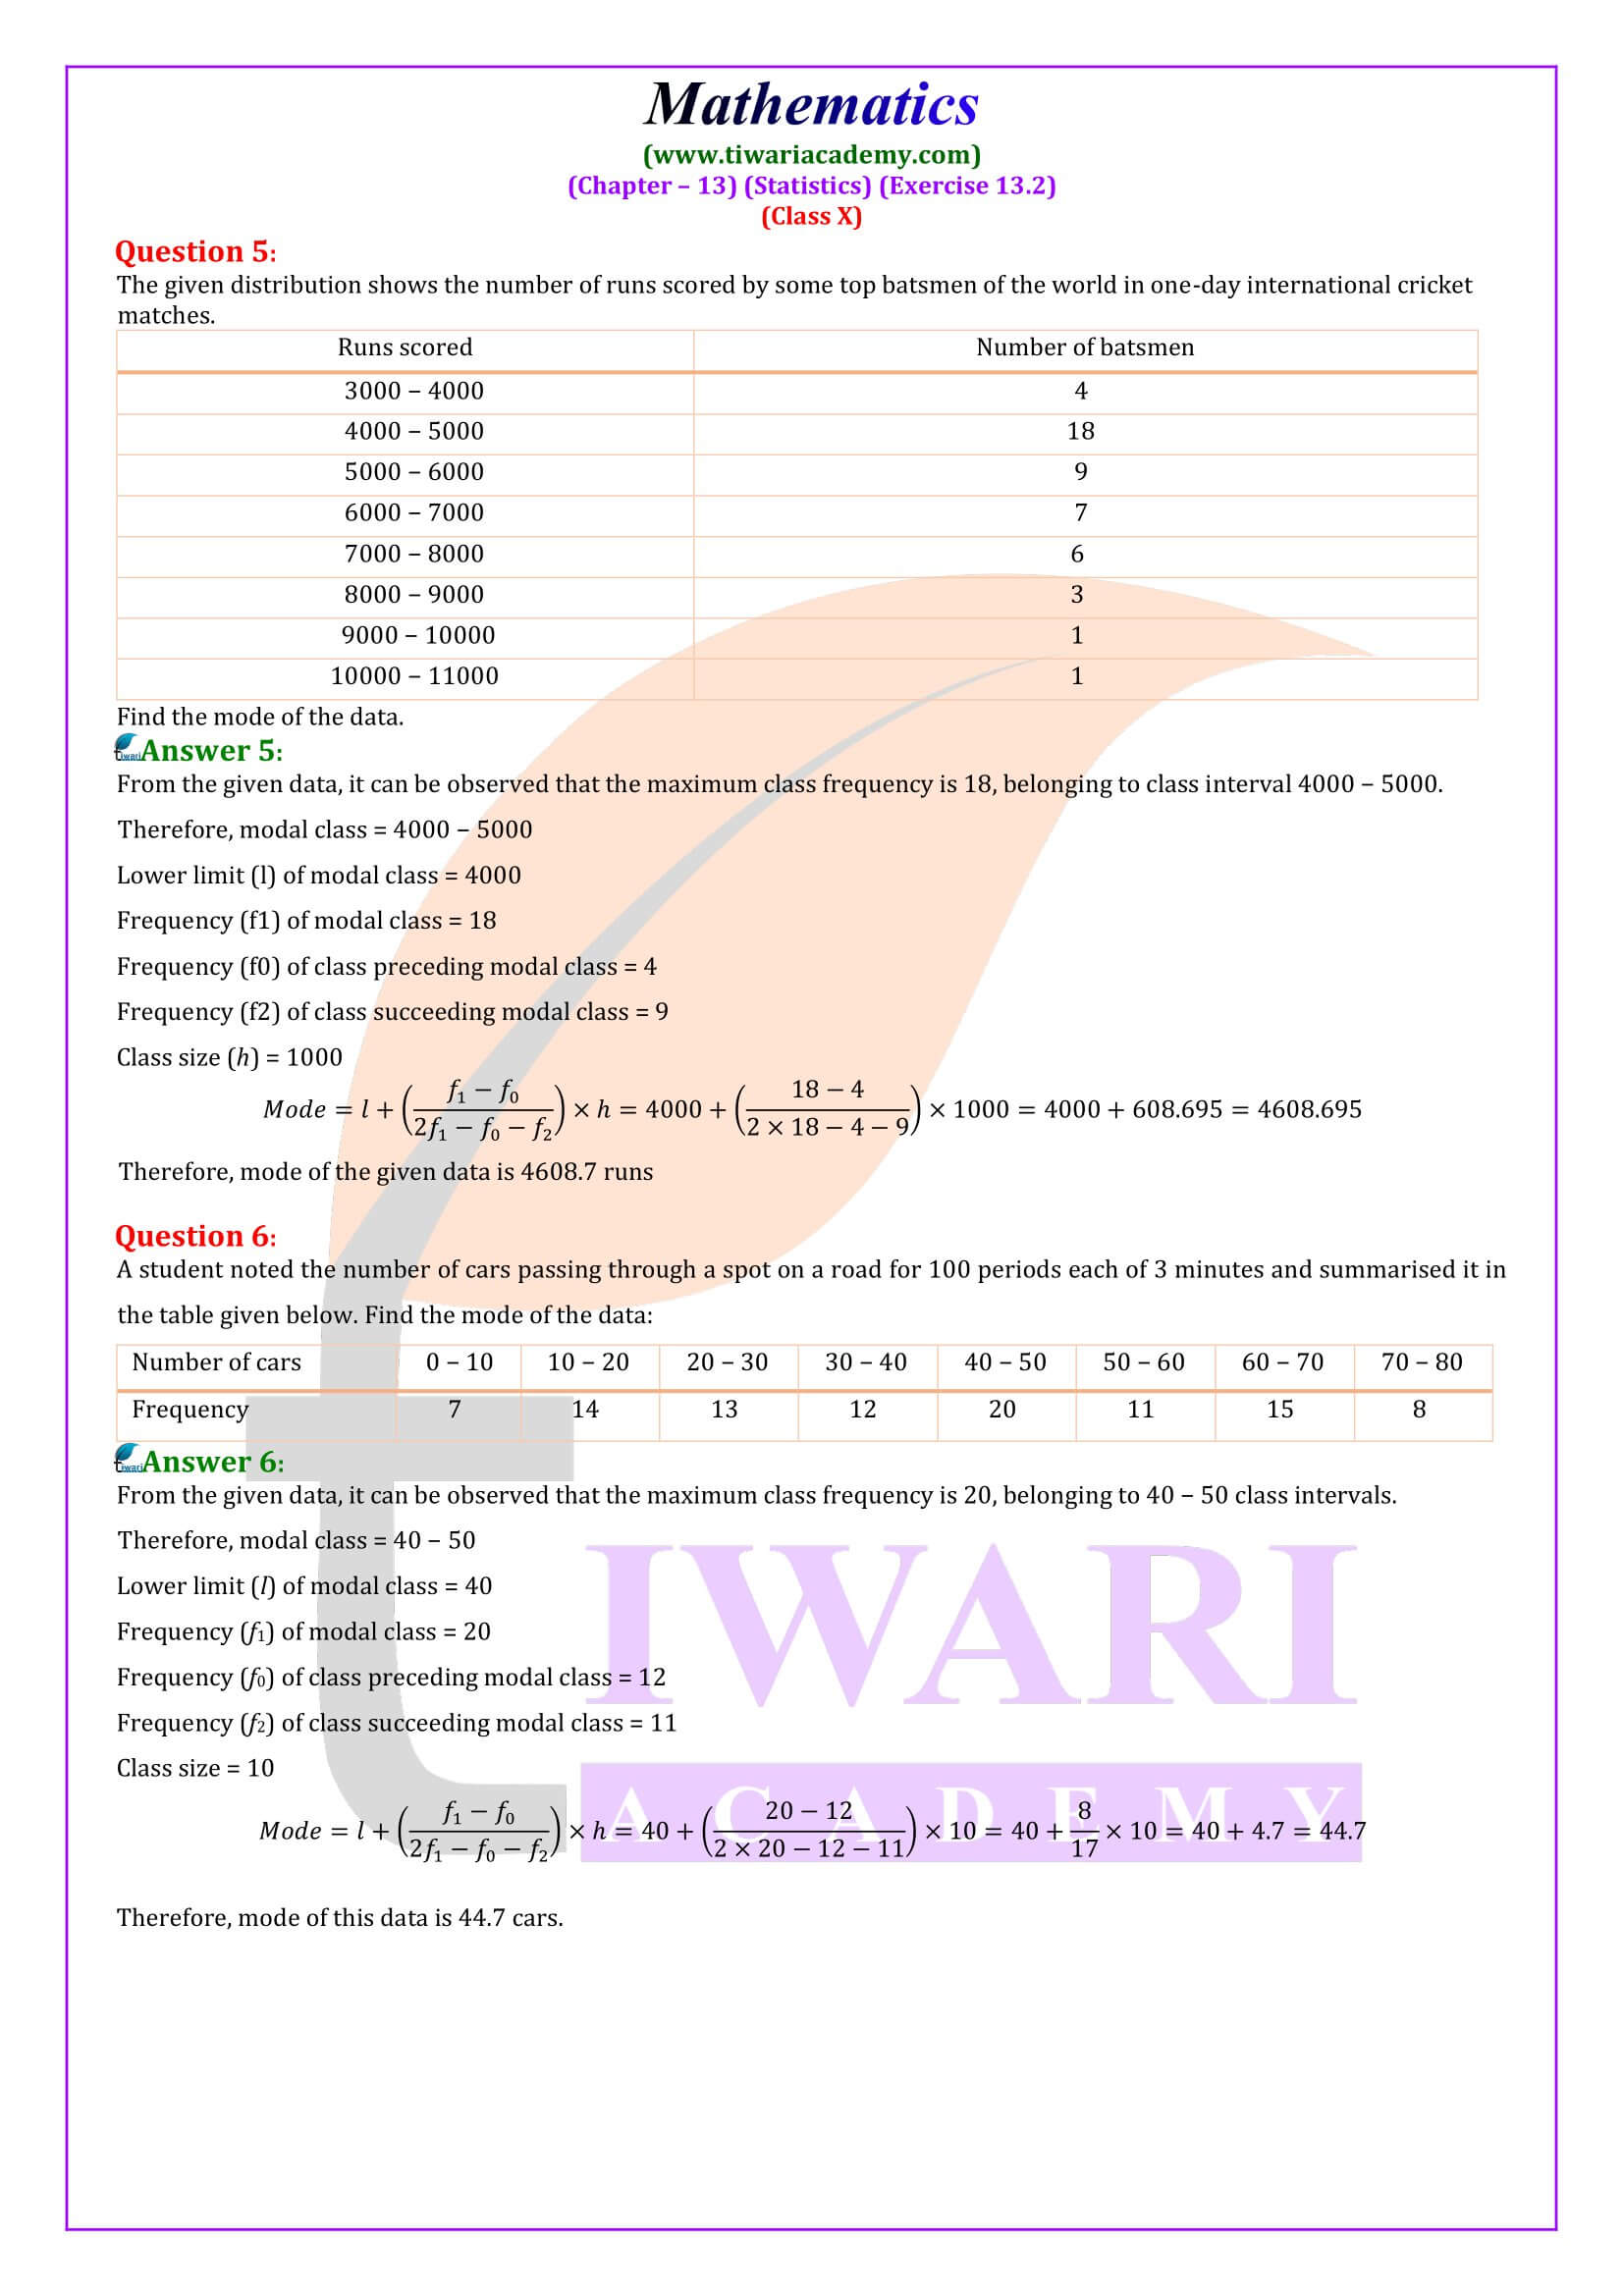
NCERT Solutions for Class 10 Maths Chapter 13 Exercise 13.2 Statistics in Hindi and English Medium modified according current curriculum 2025-26. The solutions of ex. 13.2 is given in the format of PDF, Videos and Images, so that student understand it comfortably.
Class 10 Maths Exercise 13.2 Solutions
Class 10 Maths Exercise 13.2 in Hindi
Class 10 Maths NCERT Book Download
Class 10 Maths Chapter 13 Solutions
Class 10 Maths all Chapters Solutions
Class 10 all Subjects NCERT Solutions
Class 10 Maths Exercise 13.2 Solutions in Hindi and English Medium
To prepare for Class 10 Maths Exercise 13.2, understand the importance of the mode as a measure of central tendency. The mode represents the value that occurs most frequently. For grouped data, you must find the modal class, which has the highest frequency. Learn the formula for mode: Mode = 𝑙 + (𝑓1 − 𝑓0)/(2𝑓1 − 𝑓0 − 𝑓2)×h, where 𝑙 is the lower limit of the modal class, 𝑓1 is the frequency of the modal class, 𝑓0 is the frequency of the class preceding the modal class, 𝑓2 is the frequency of the class succeeding the modal class, and ℎ is the class size.
Practice calculating the mode by solving examples that include constructing frequency tables and identifying the modal class. Make sure to understand the steps involved in applying the formula correctly. Compare the mode with the mean and median to see how they differ and what each one represents. This will help you grasp how central tendency measures can provide different insights about a dataset.
| Class: 10 | Mathematics |
| Chapter: 13 | Statistics |
| Exercise: 13.2 | NCERT Solutions PDF and Videos |
| Session: | Academic Year 2025-26 |
| Medium: | Hindi and English Medium |
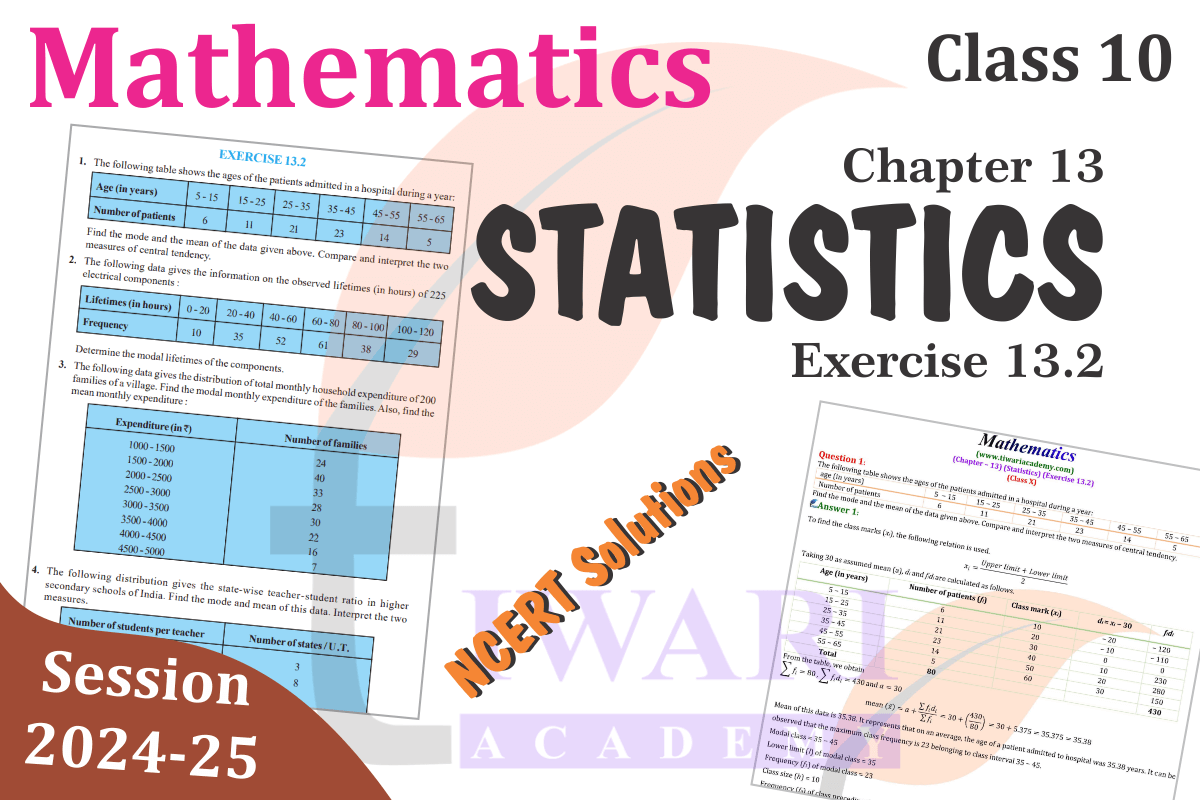
Questions in ex. 13.2 are based on Mode. Answers of all questions based on Mode are given in Hindi Medium as well as English Medium free to use for all students updated for academic session 2025-26 based on latest CBSE Curriculum. Videos related to exercise 13.2 of statistics are given in Hindi and English medium separately. Practice with PDF solutions and take help of videos to understand more confidently.
Statistics in Earlier Classes
The classification of the given data is studied in cluster and non-cluster frequency distributions. You have learned to represent data graphically in various charts, such as bar charts, histograms (including ones of different widths), and frequency polygons. Actually, he went a step further by checking some numerical representations of data, also called measures of central tendency, namely mean, mean, and mode. In this chapter, we will expand the study of these three measures, that is, the mean, mean, and mode of non-grouped data in grouped data. We will discuss cumulative frequency, the concept of cumulative frequency distribution, and cumulative frequency curves, also known as warheads.
Mode of Grouped Data
As we have studied in previous classes, one mode is the value between the observations that occur with the highest frequency, that is, the value of the observation that has the maximum frequency. In addition, we know how to find the mode of unstructured data. Here, we are going to discuss ways to achieve a pooled data mode. It is possible that more than one value has the same maximum frequency. In such situations, the data is called a multimodal. Although grouped data can also be multidimensional, limiting us to the problems of having only one mode.
Comparison between Mode and Mean
The mode may be less than the mean in one situation, but in some other problems, it may be equal to or greater than the mean. It depends on the situation demand if we are interested in finding the average marks obtained by the students or the average of the marks obtained by most students. The first condition requires the mean and the second condition requires the mode.
How to find a Mode of data?
In a grouped frequency distribution, it is not possible to determine the mode by observing frequencies. Here, we can only detect a square with maximum frequency, which is called a modal square. The mode is a value within the modal class and is given by the formula:
Mode = l + [(f1 – f0)/(2f1 – f0 – f2)] x h
| l | Lower limit of the modal class |
| h | Size of the class interval (assuming all class sizes to be equal) |
| f1 | Frequency of the modal class |
| f0 | Frequency of the class preceding the modal class |
| f2 | Frequency of the class succeeding the modal class |
What is the situations in 10th Maths Statistics exercise 13.2 where mode is more appropriate?
In situations which require establishing the most frequent value or most popular item, the mode is the best choice, e.g., to find the most popular T.V. programme being watched, the consumer item in greatest demand, the colour of the vehicle used by most of the people, etc.
What are important sums of exercise 13.2 of class 10 Maths?
In exercise 13.2 of class 10 Maths, there are 6 questions and three examples (examples 4, 5, 6). All questions and examples of this exercise are important from the exam point of view.
How much time students need to complete exercise 13.2 of class 10th mathematics?
Students need a maximum of two days to complete exercise 13.2 (chapter 13) of class 10th mathematics if they give 1-2 hours per day to this exercise. This time also depends on student’s speed, efficiency, capability and many other factors.
What will students learn in exercise 13.2 of class 10 Maths?
In exercise 13.2 of class 10 math, students will learn how to find Mode of Grouped Data. This exercise is easy but needs practice to avoid calculation mistakes.
