NCERT Solutions for Class 6 Maths Ganit Prakash Chapter 4 Data Handling and Presentation updated for academic session 2025-26. Get insights on how to collect, organise and present data using tables and graphs.
Class 6 Maths Ganita Prakash Chapter 4 Data Handling and Presentation Question Answers
Introduction to Class 6 Maths Ganit Prakash Chapter 4 Data Handling
Data is everywhere! Whether it’s your favorite color or the number of books you read last year, these are all examples of data. In Chapter 4, Data Handling and Presentation, we learn how to collect, organise, and present data in a way that’s easy to understand. For example, if you asked your classmates about their favorite games, you would get a list of games. This list is data. But how can you make sense of it? That’s what this chapter is all about. To get the best solutions for this chapter, you can visit Tiwari Academy.
Collecting and Organising Data
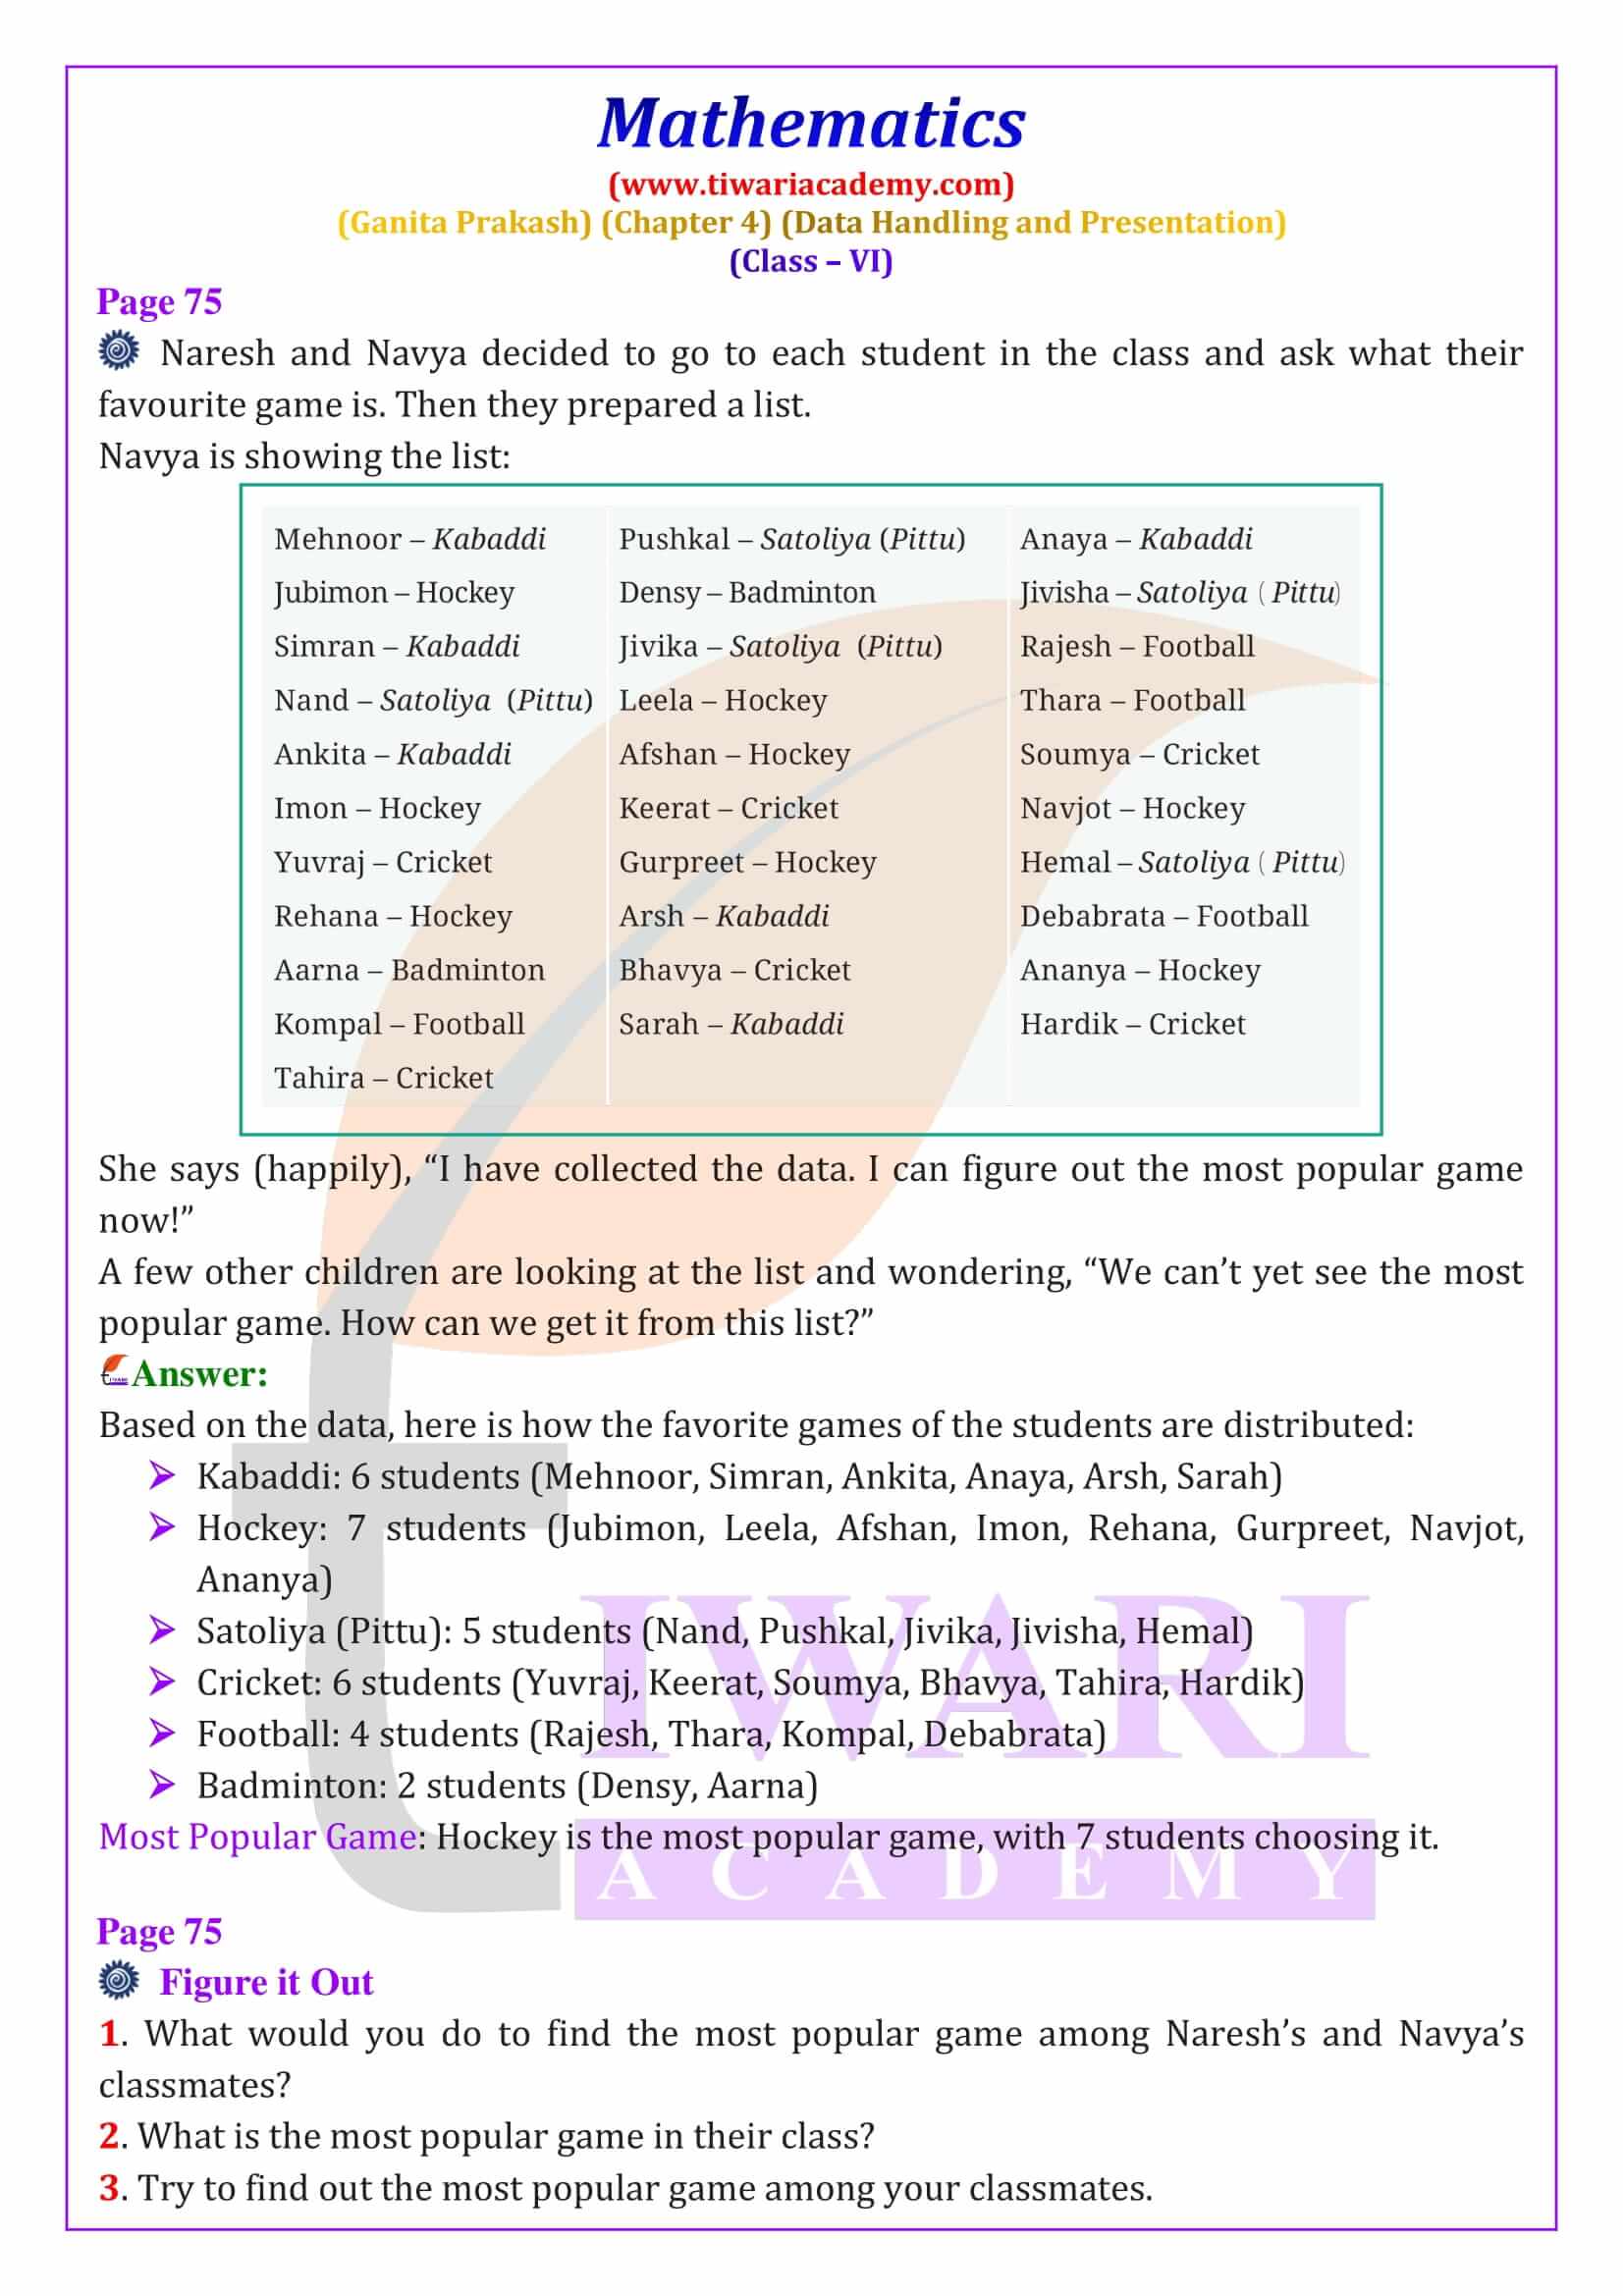
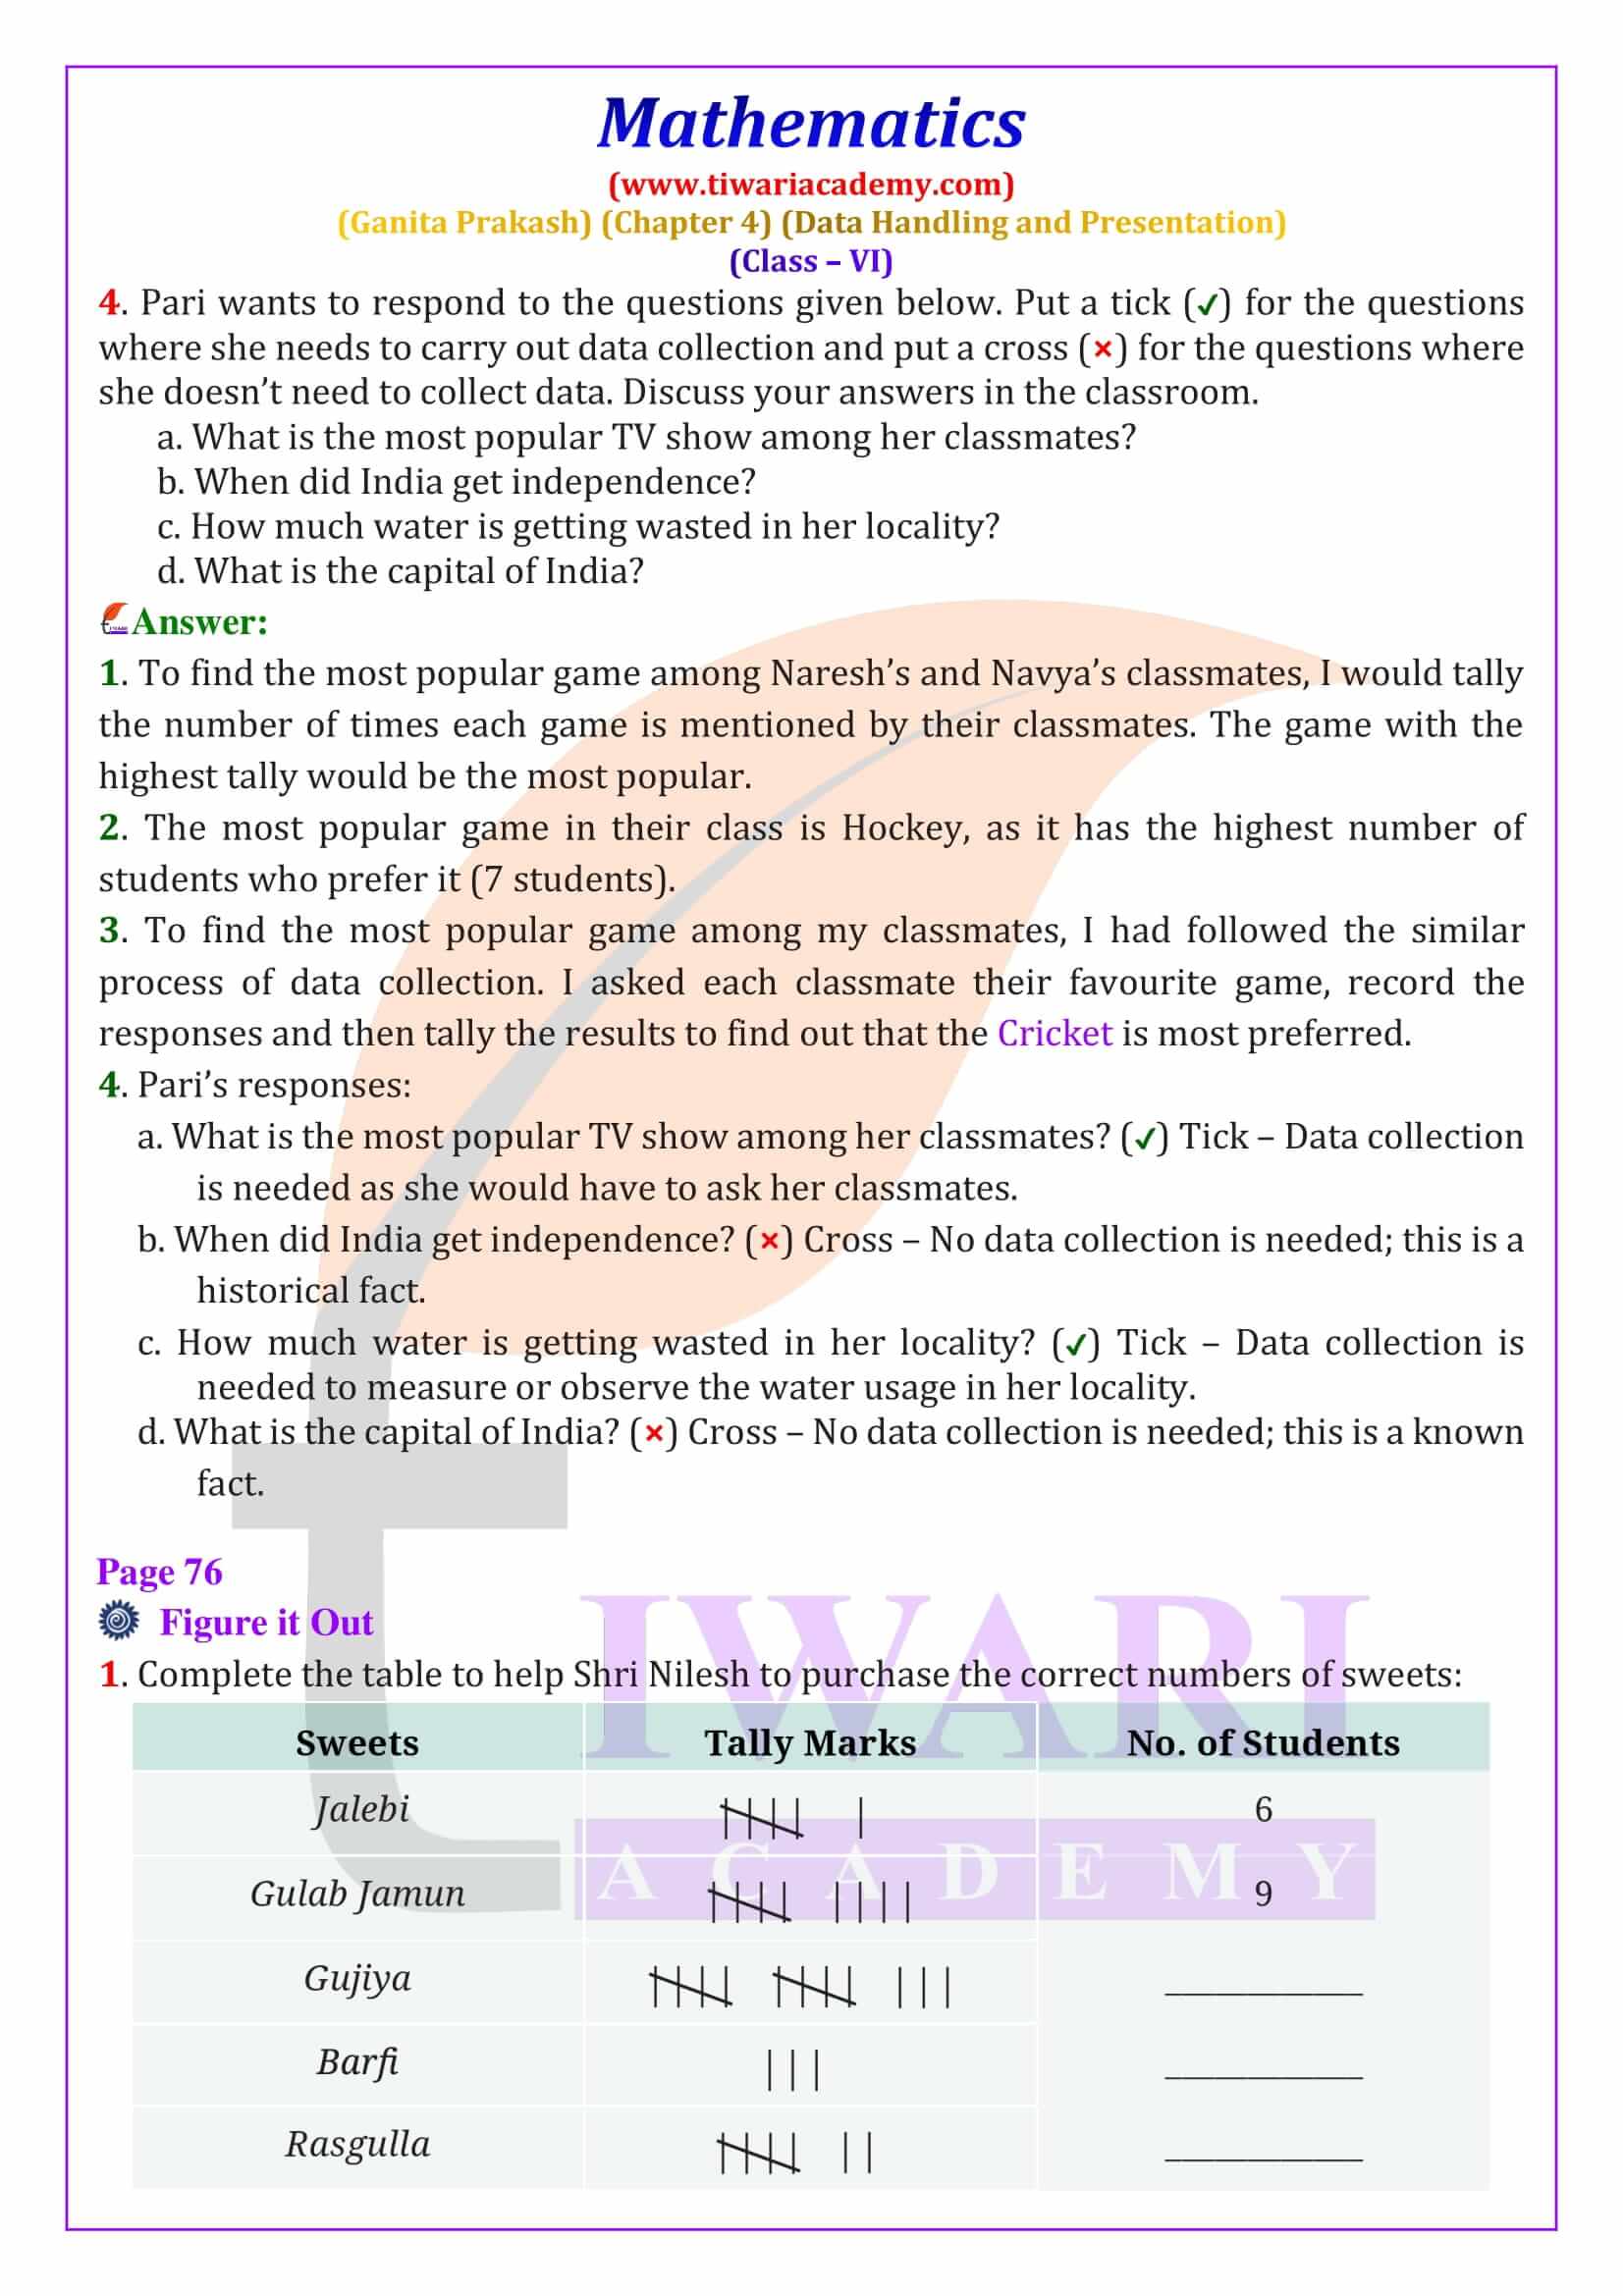
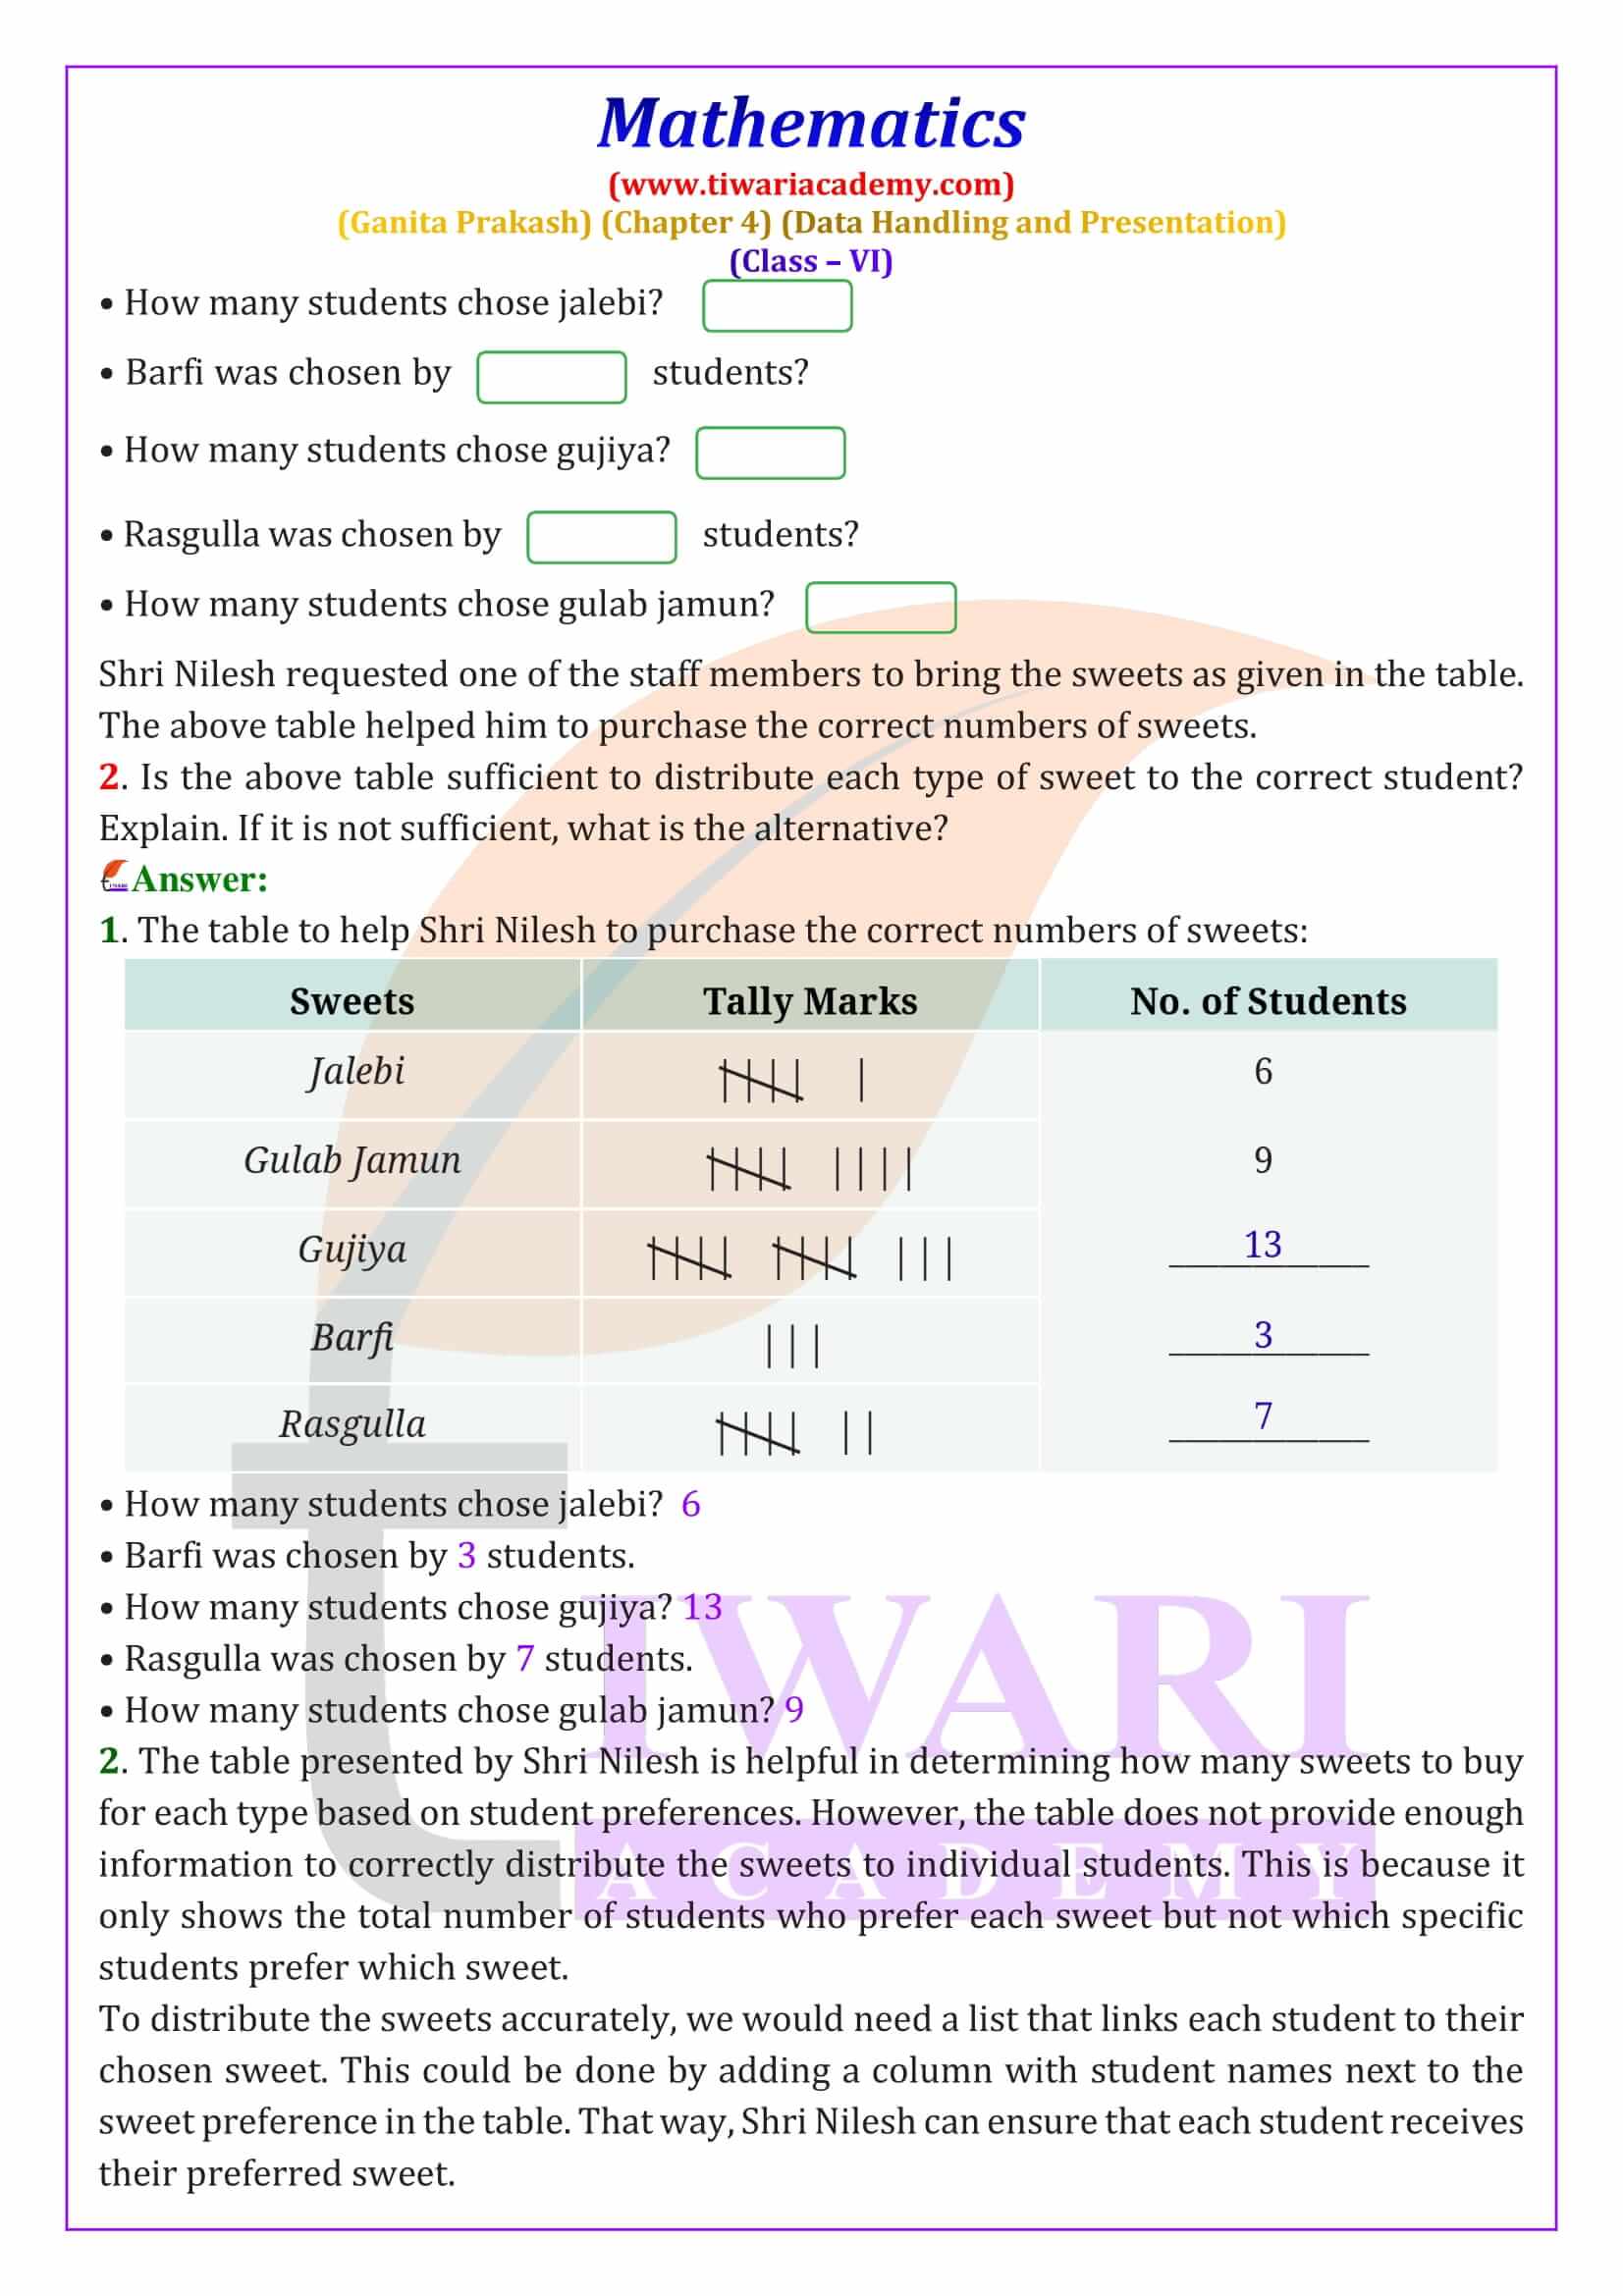
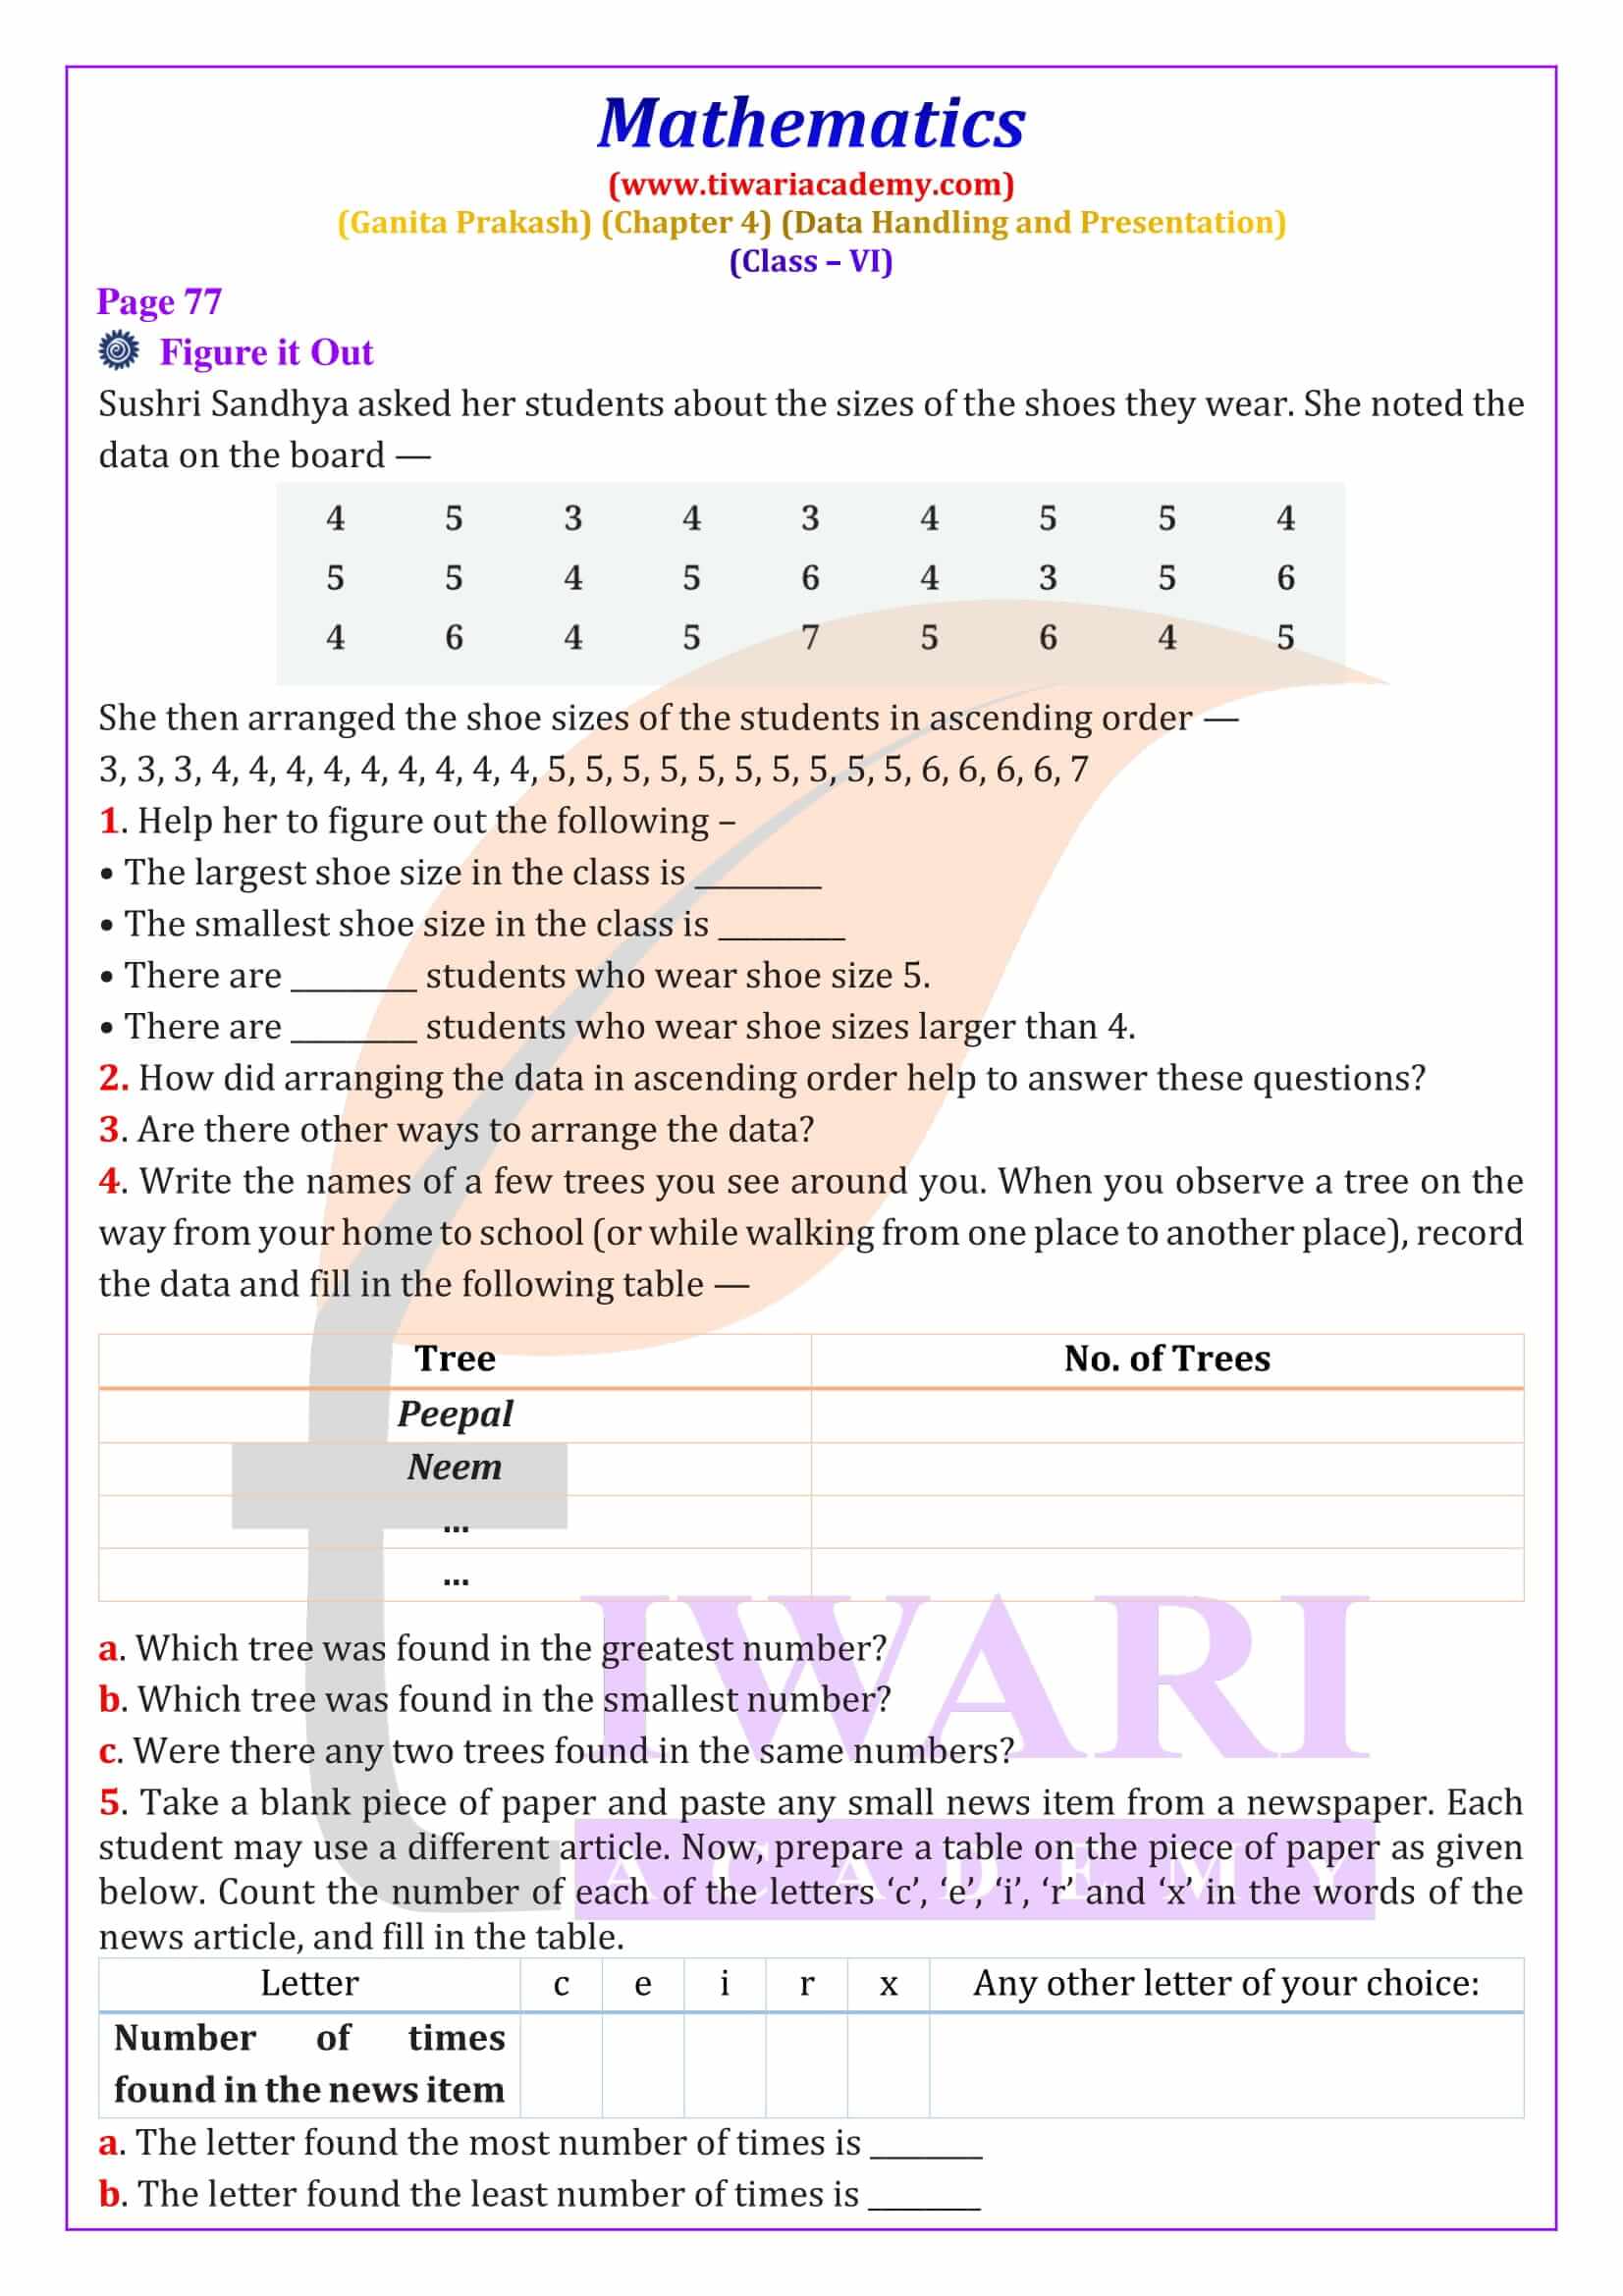
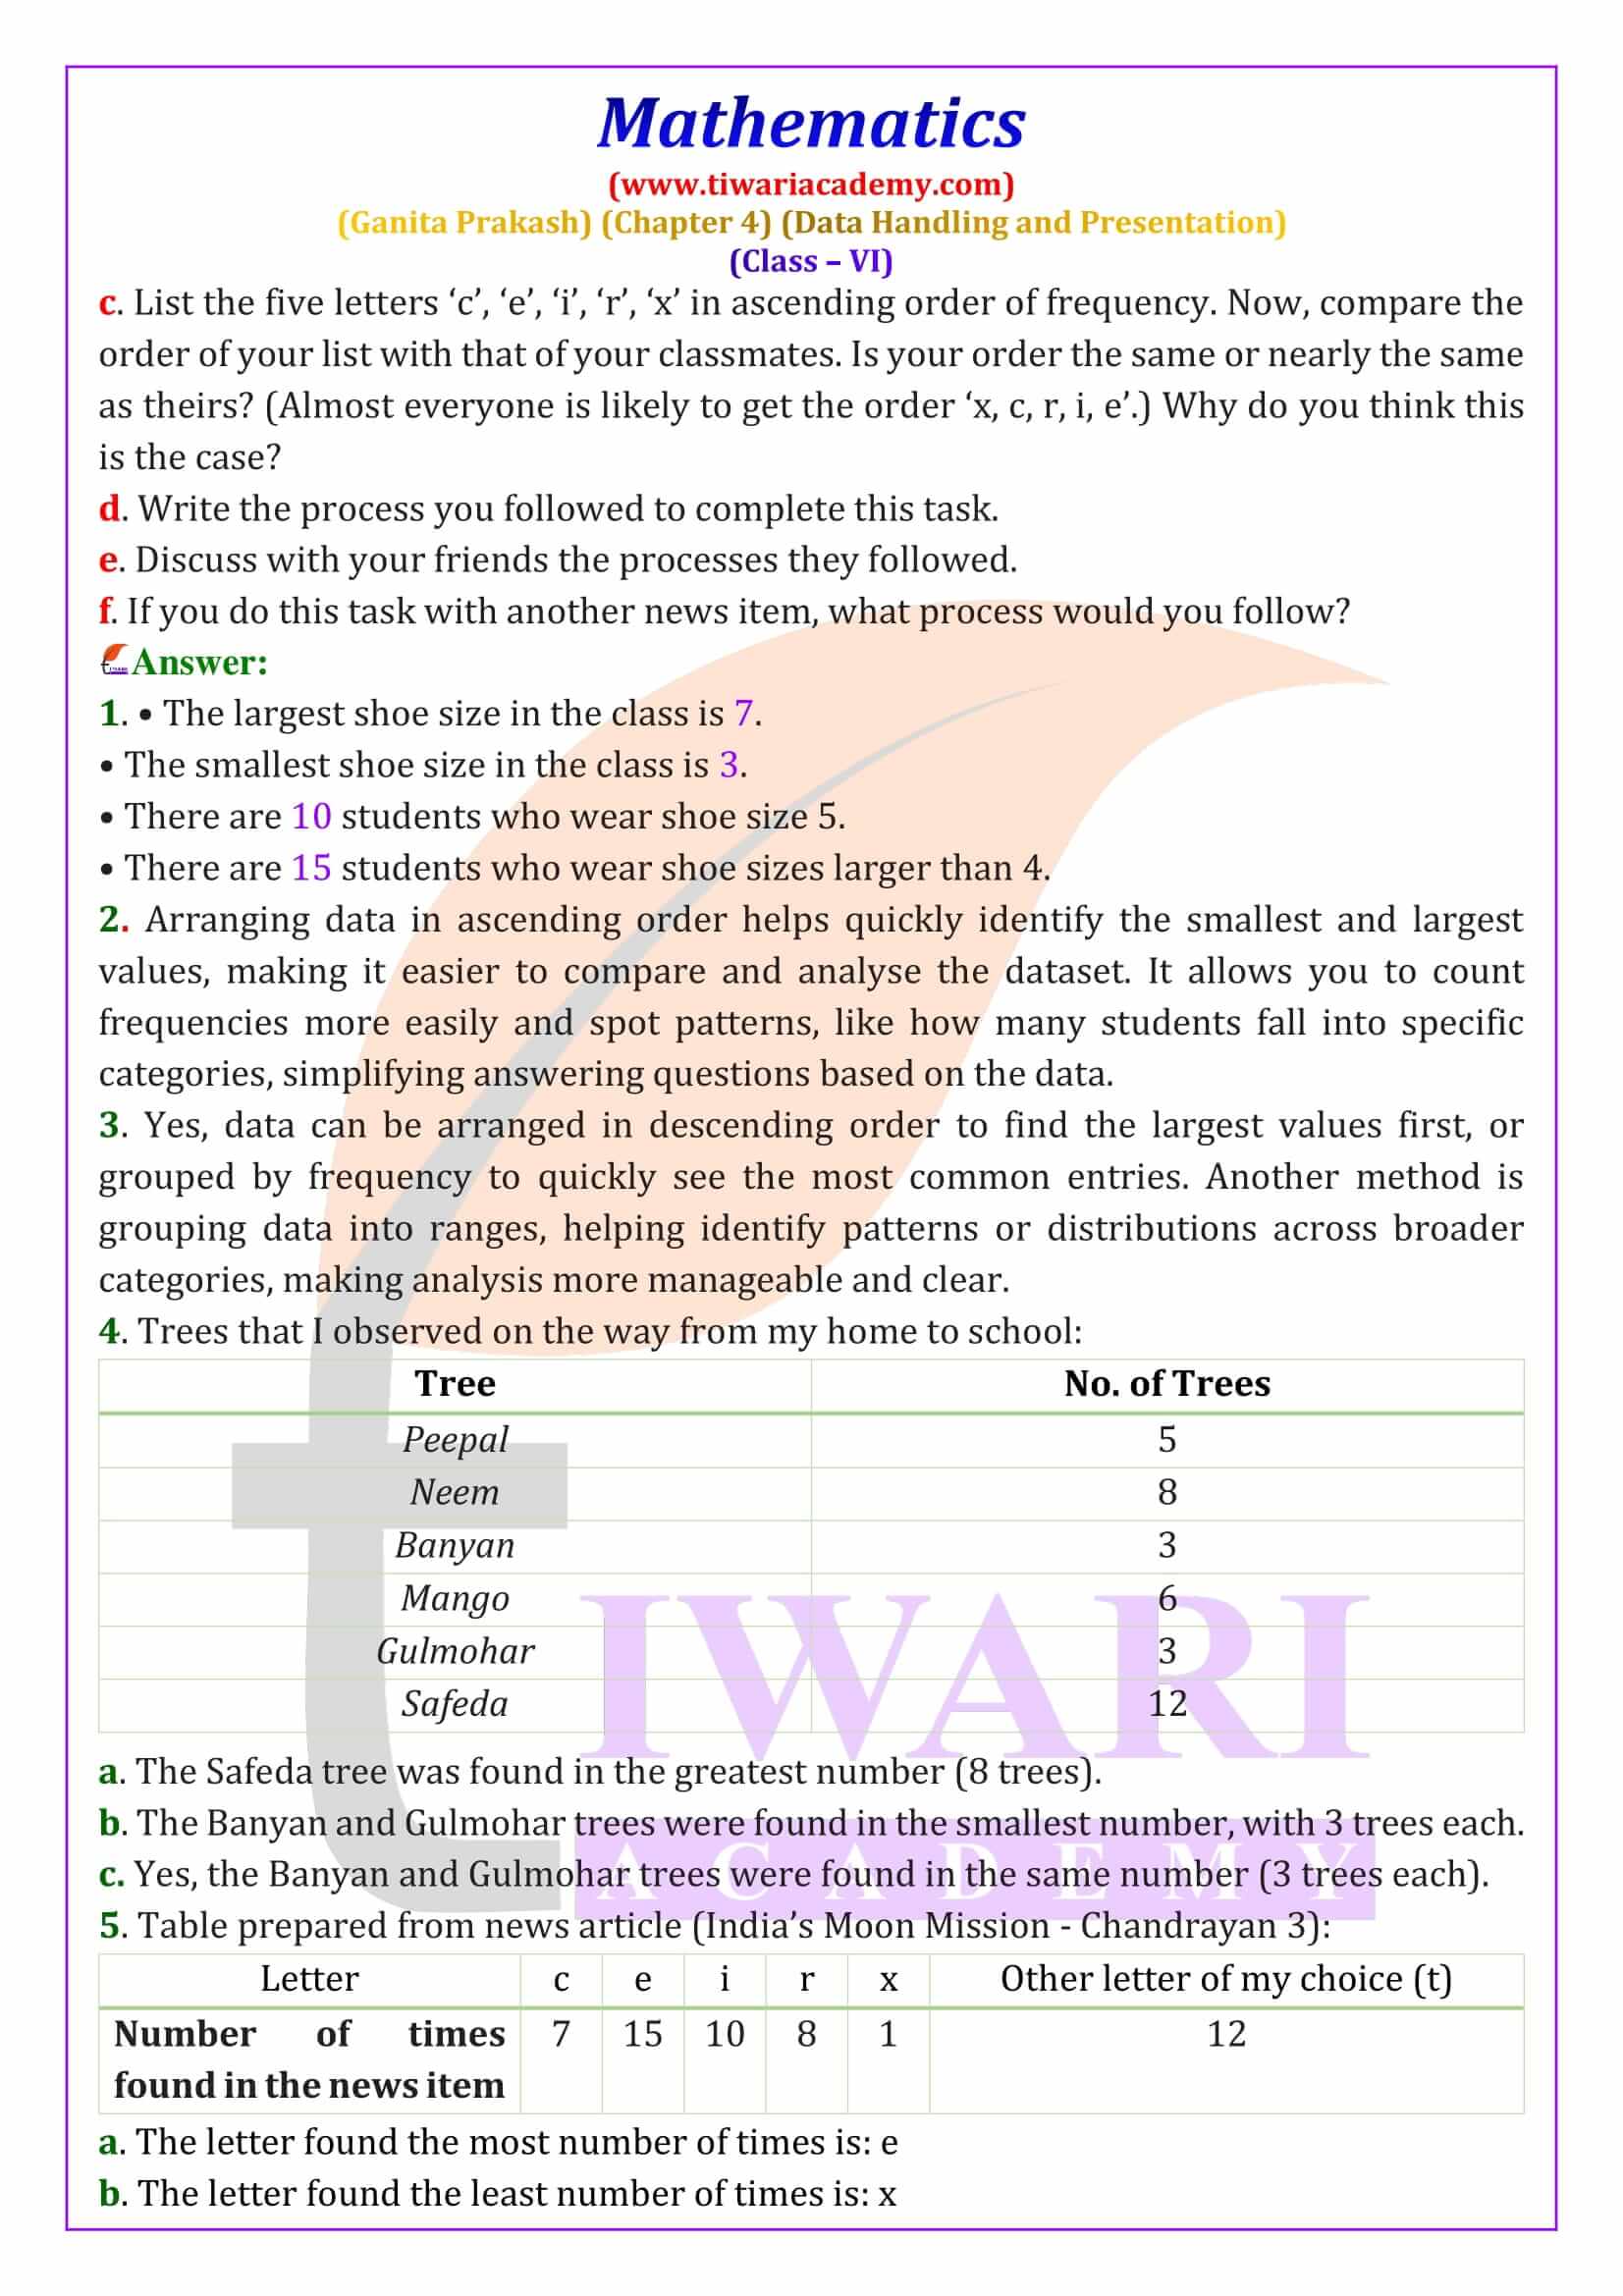
The first step in handling data is collecting it. Suppose you want to know the most popular game in your class. You can ask each student and write down their answers. This raw information is data. But simply having a long list doesn’t help much. You need to organise the data, like making a table or chart, to see which game is most popular. By organising your data, you can easily find patterns. Tiwari Academy provides organised NCERT solutions that help you understand these concepts better.
What is Pictographs?
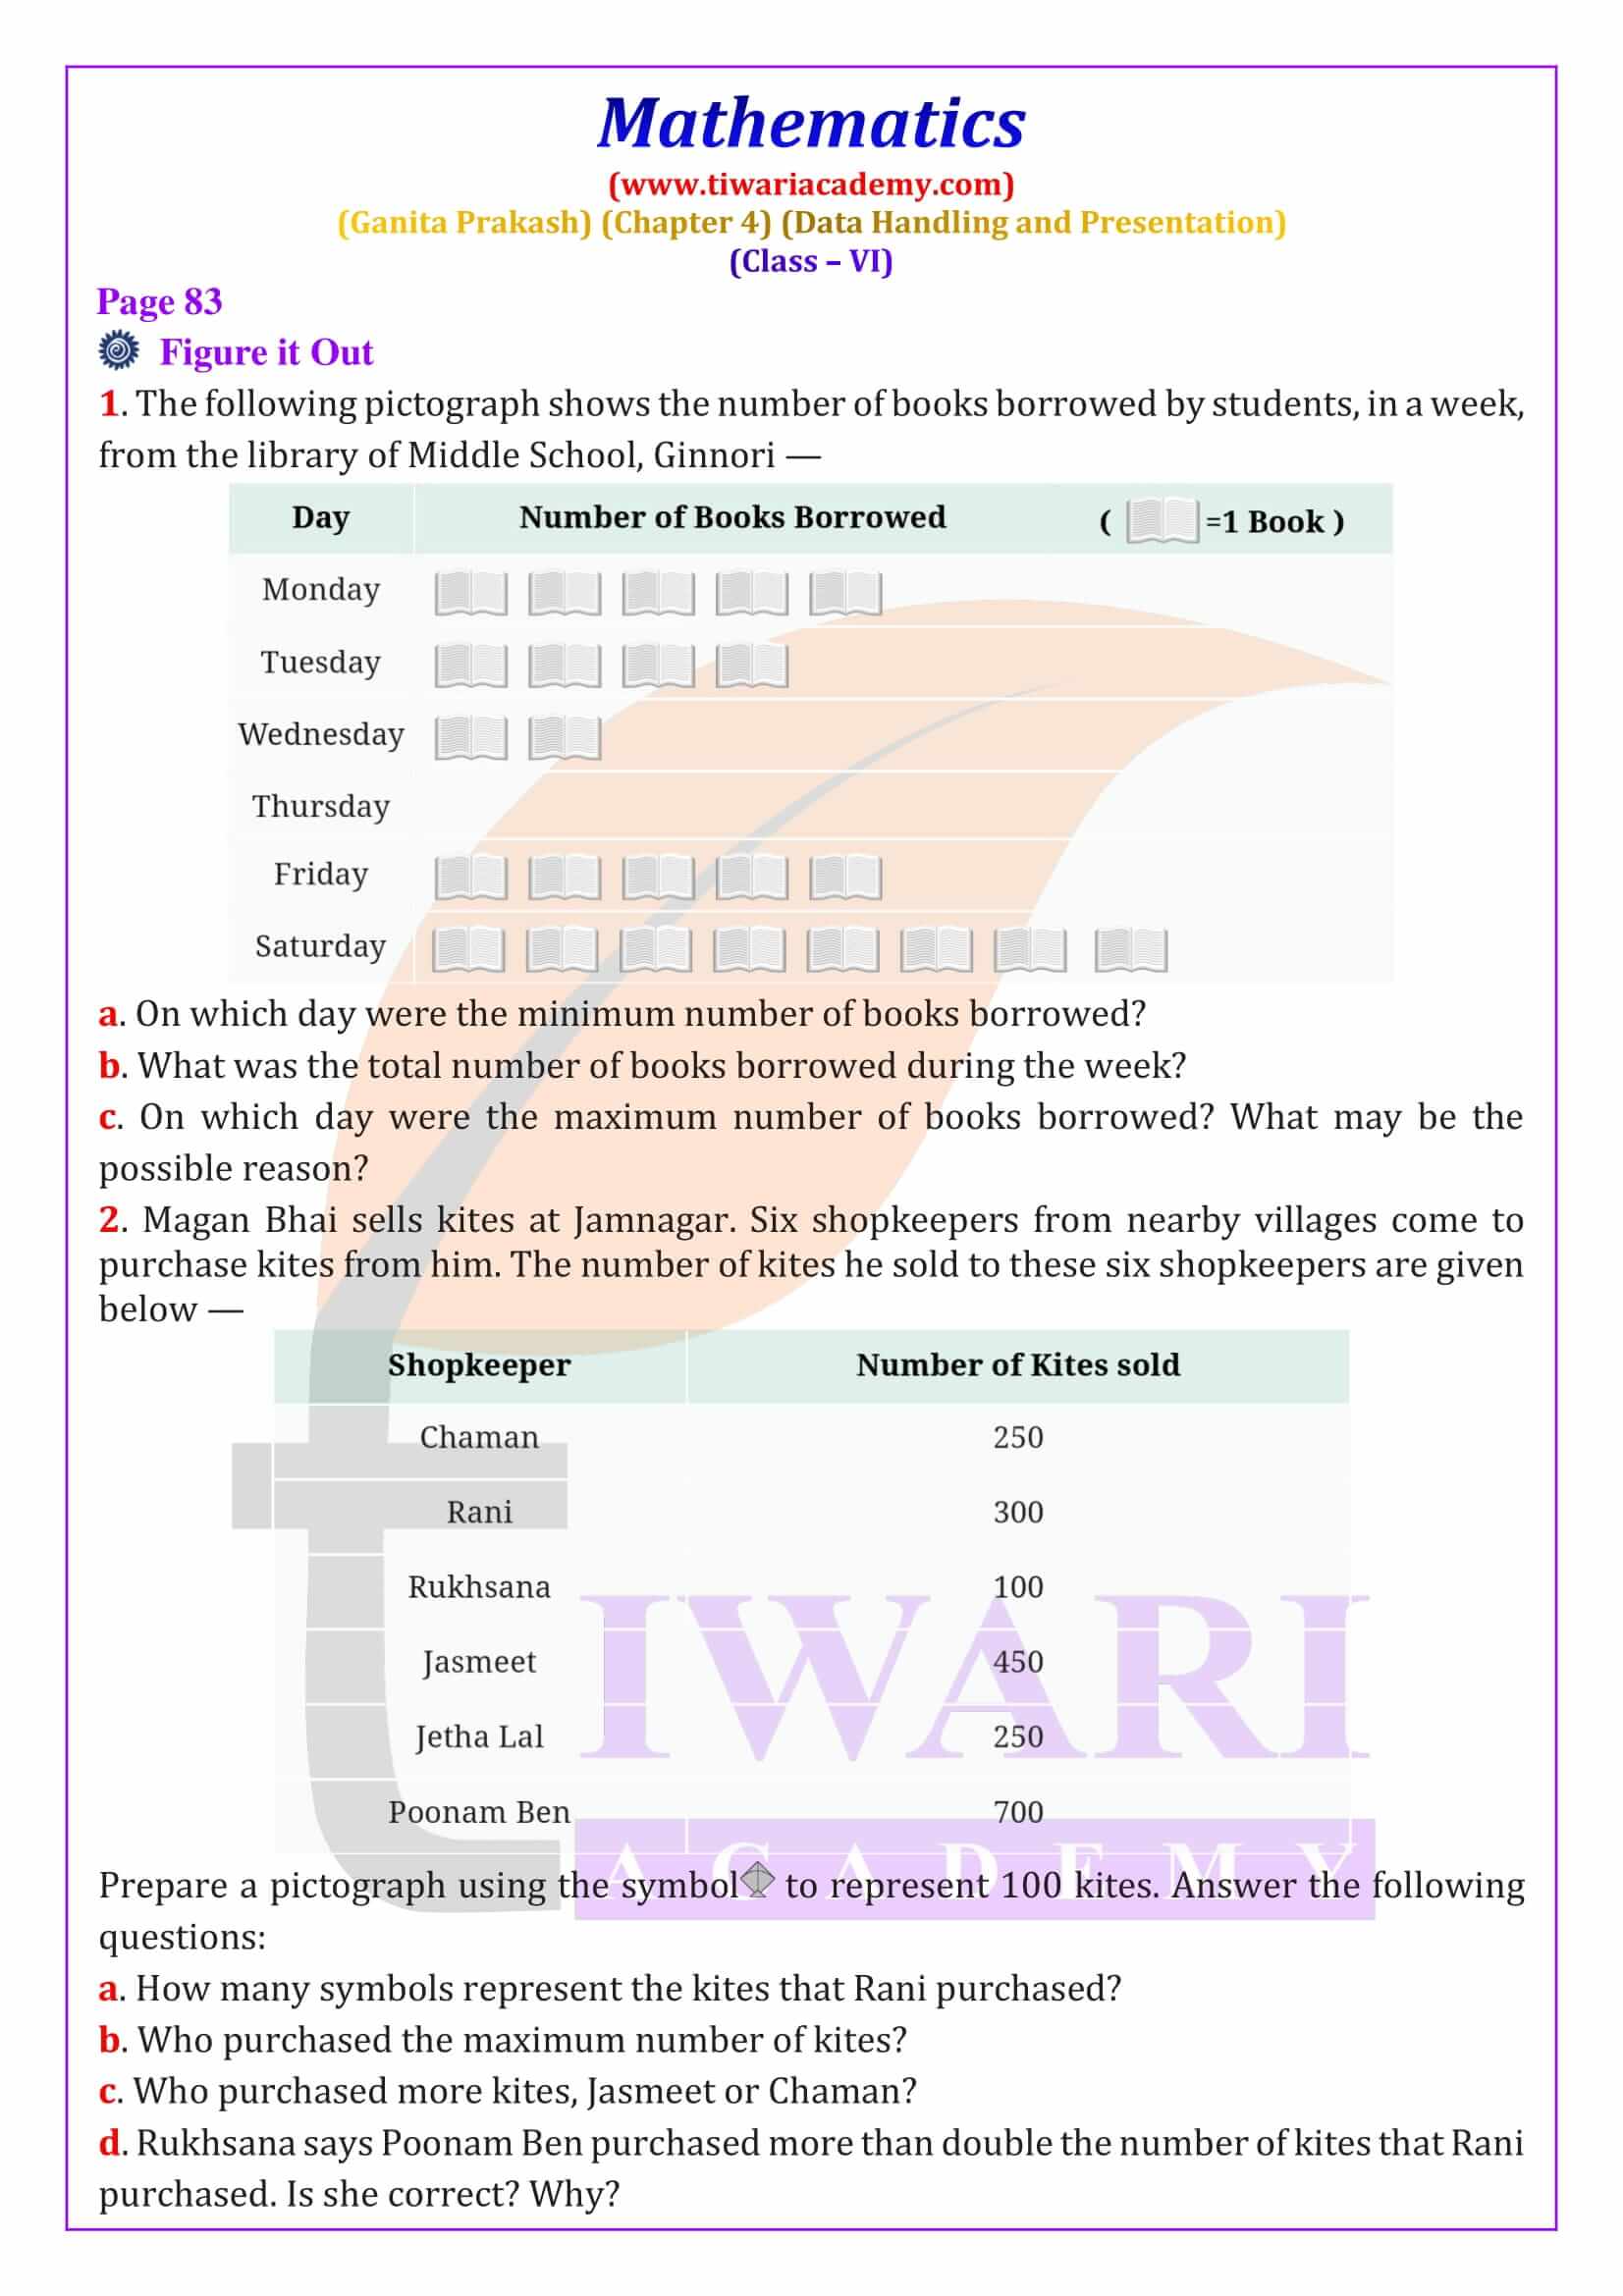
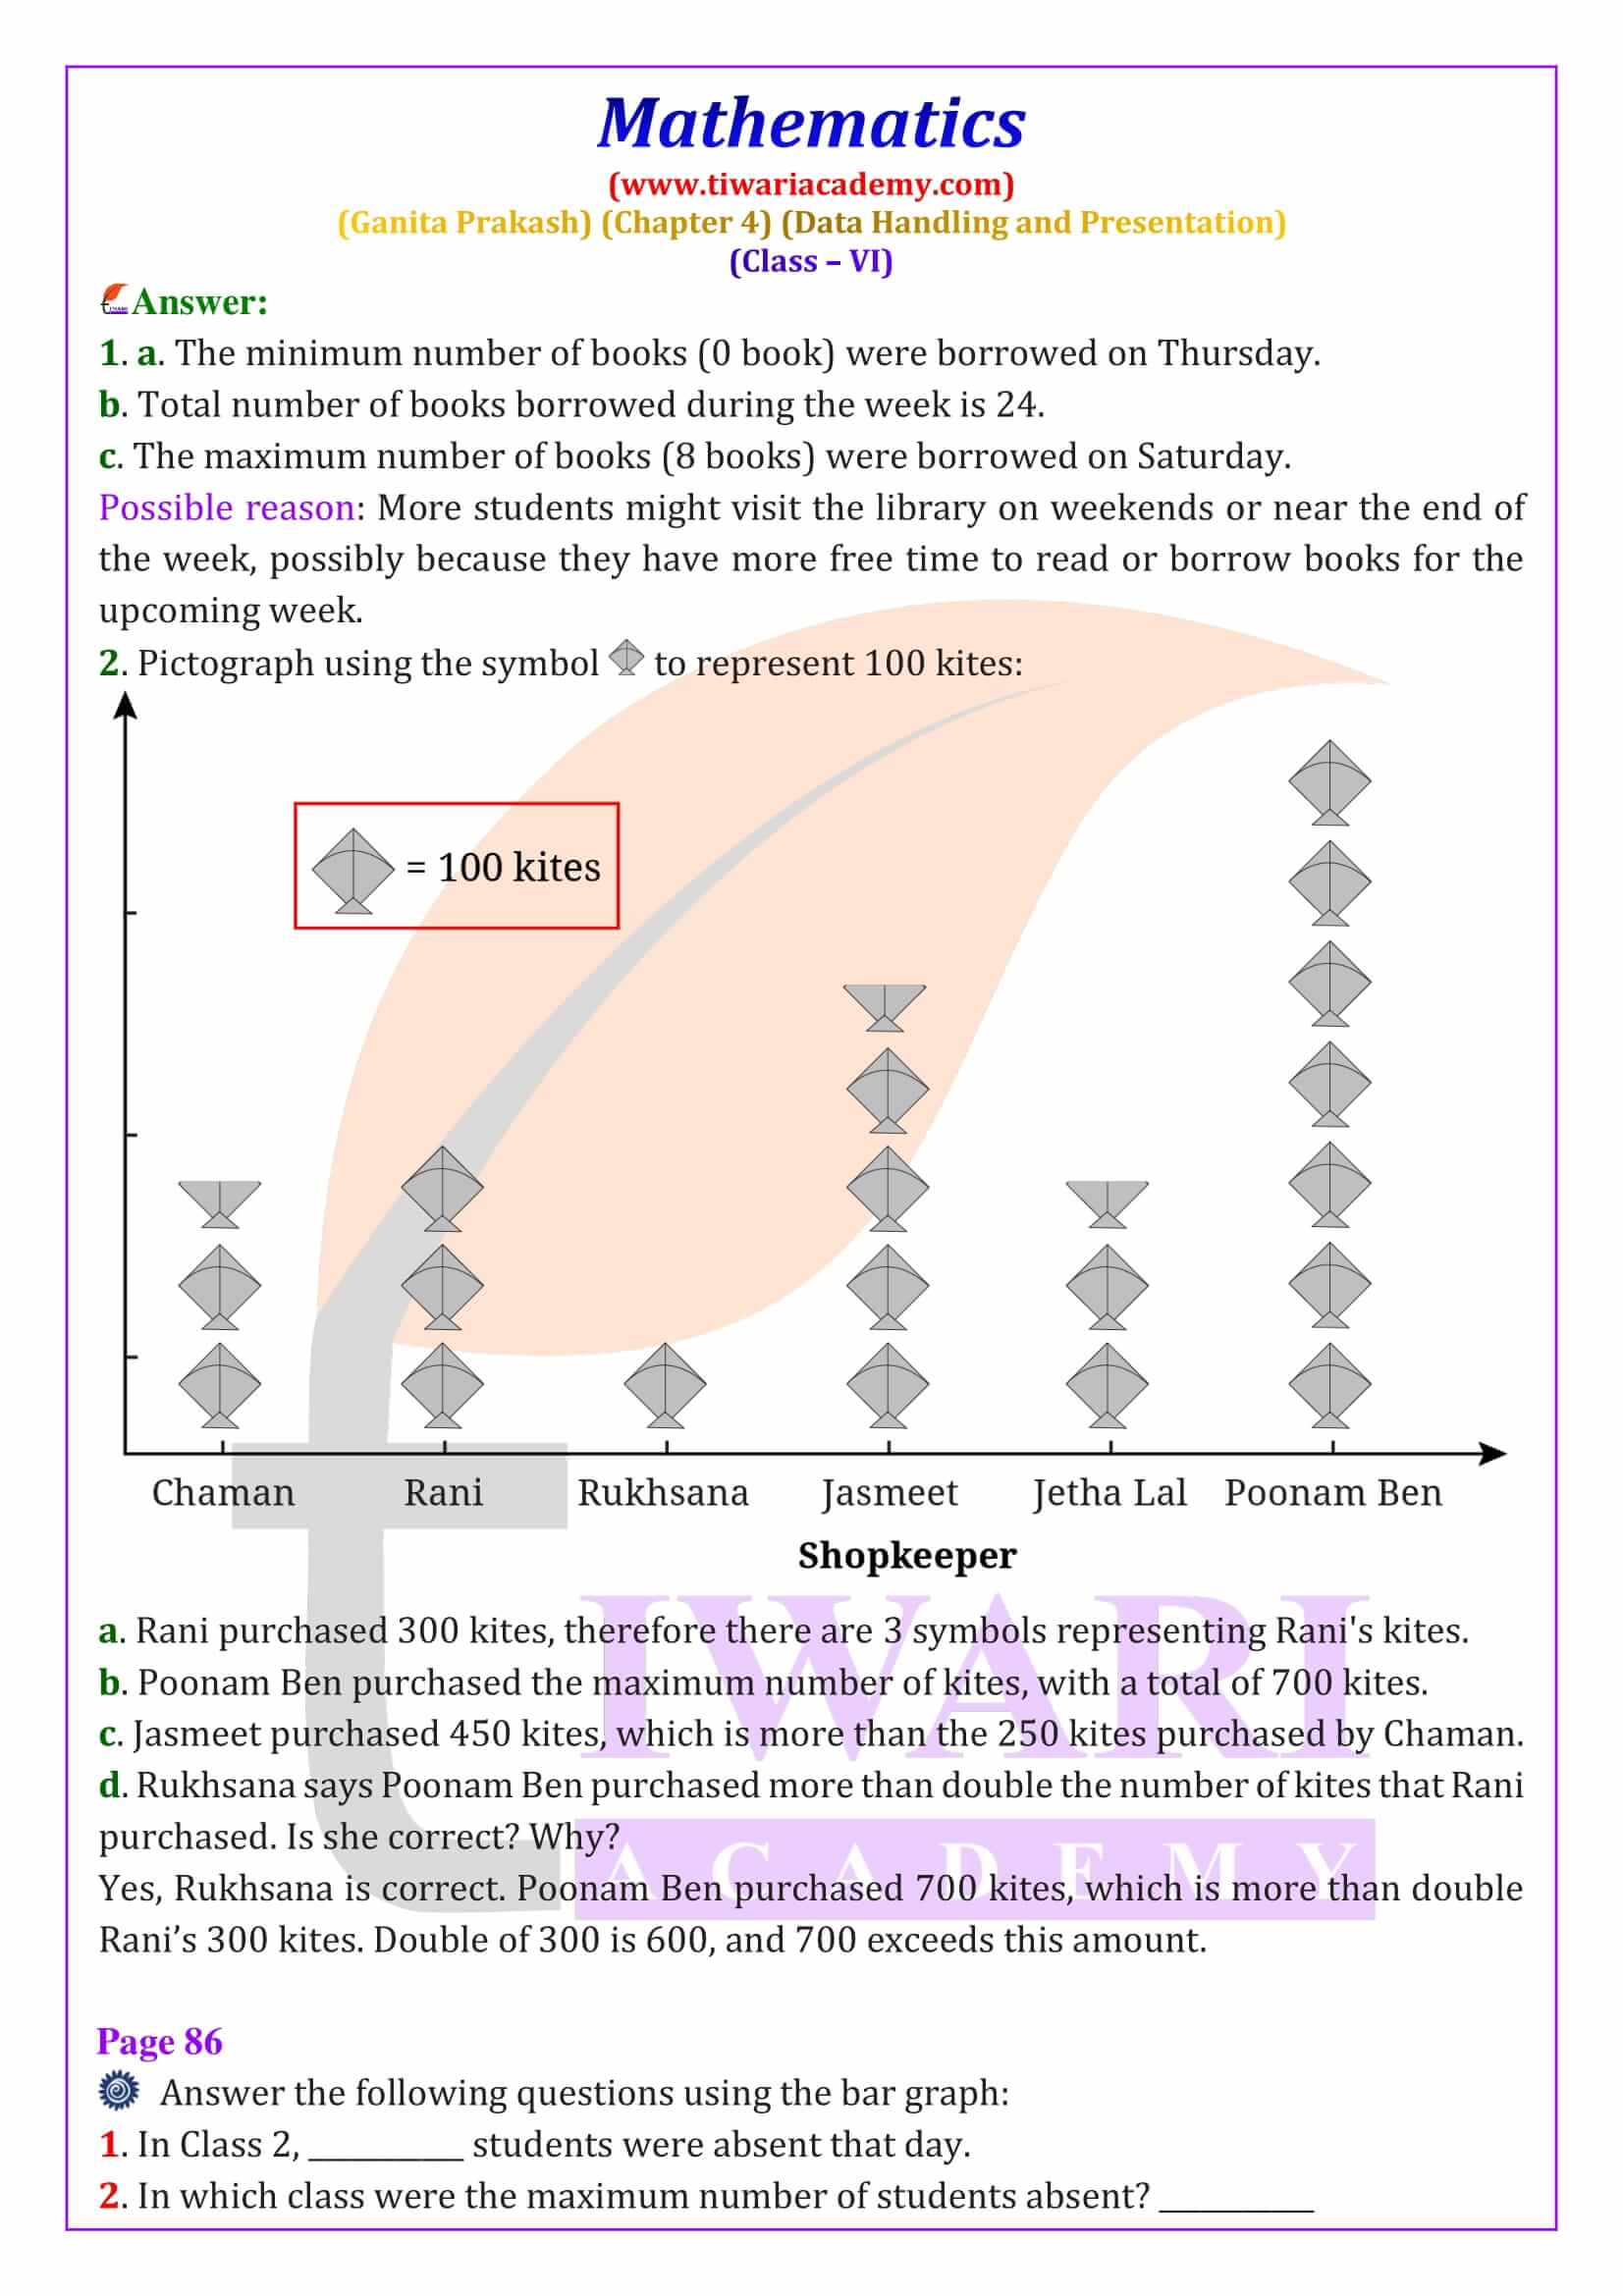
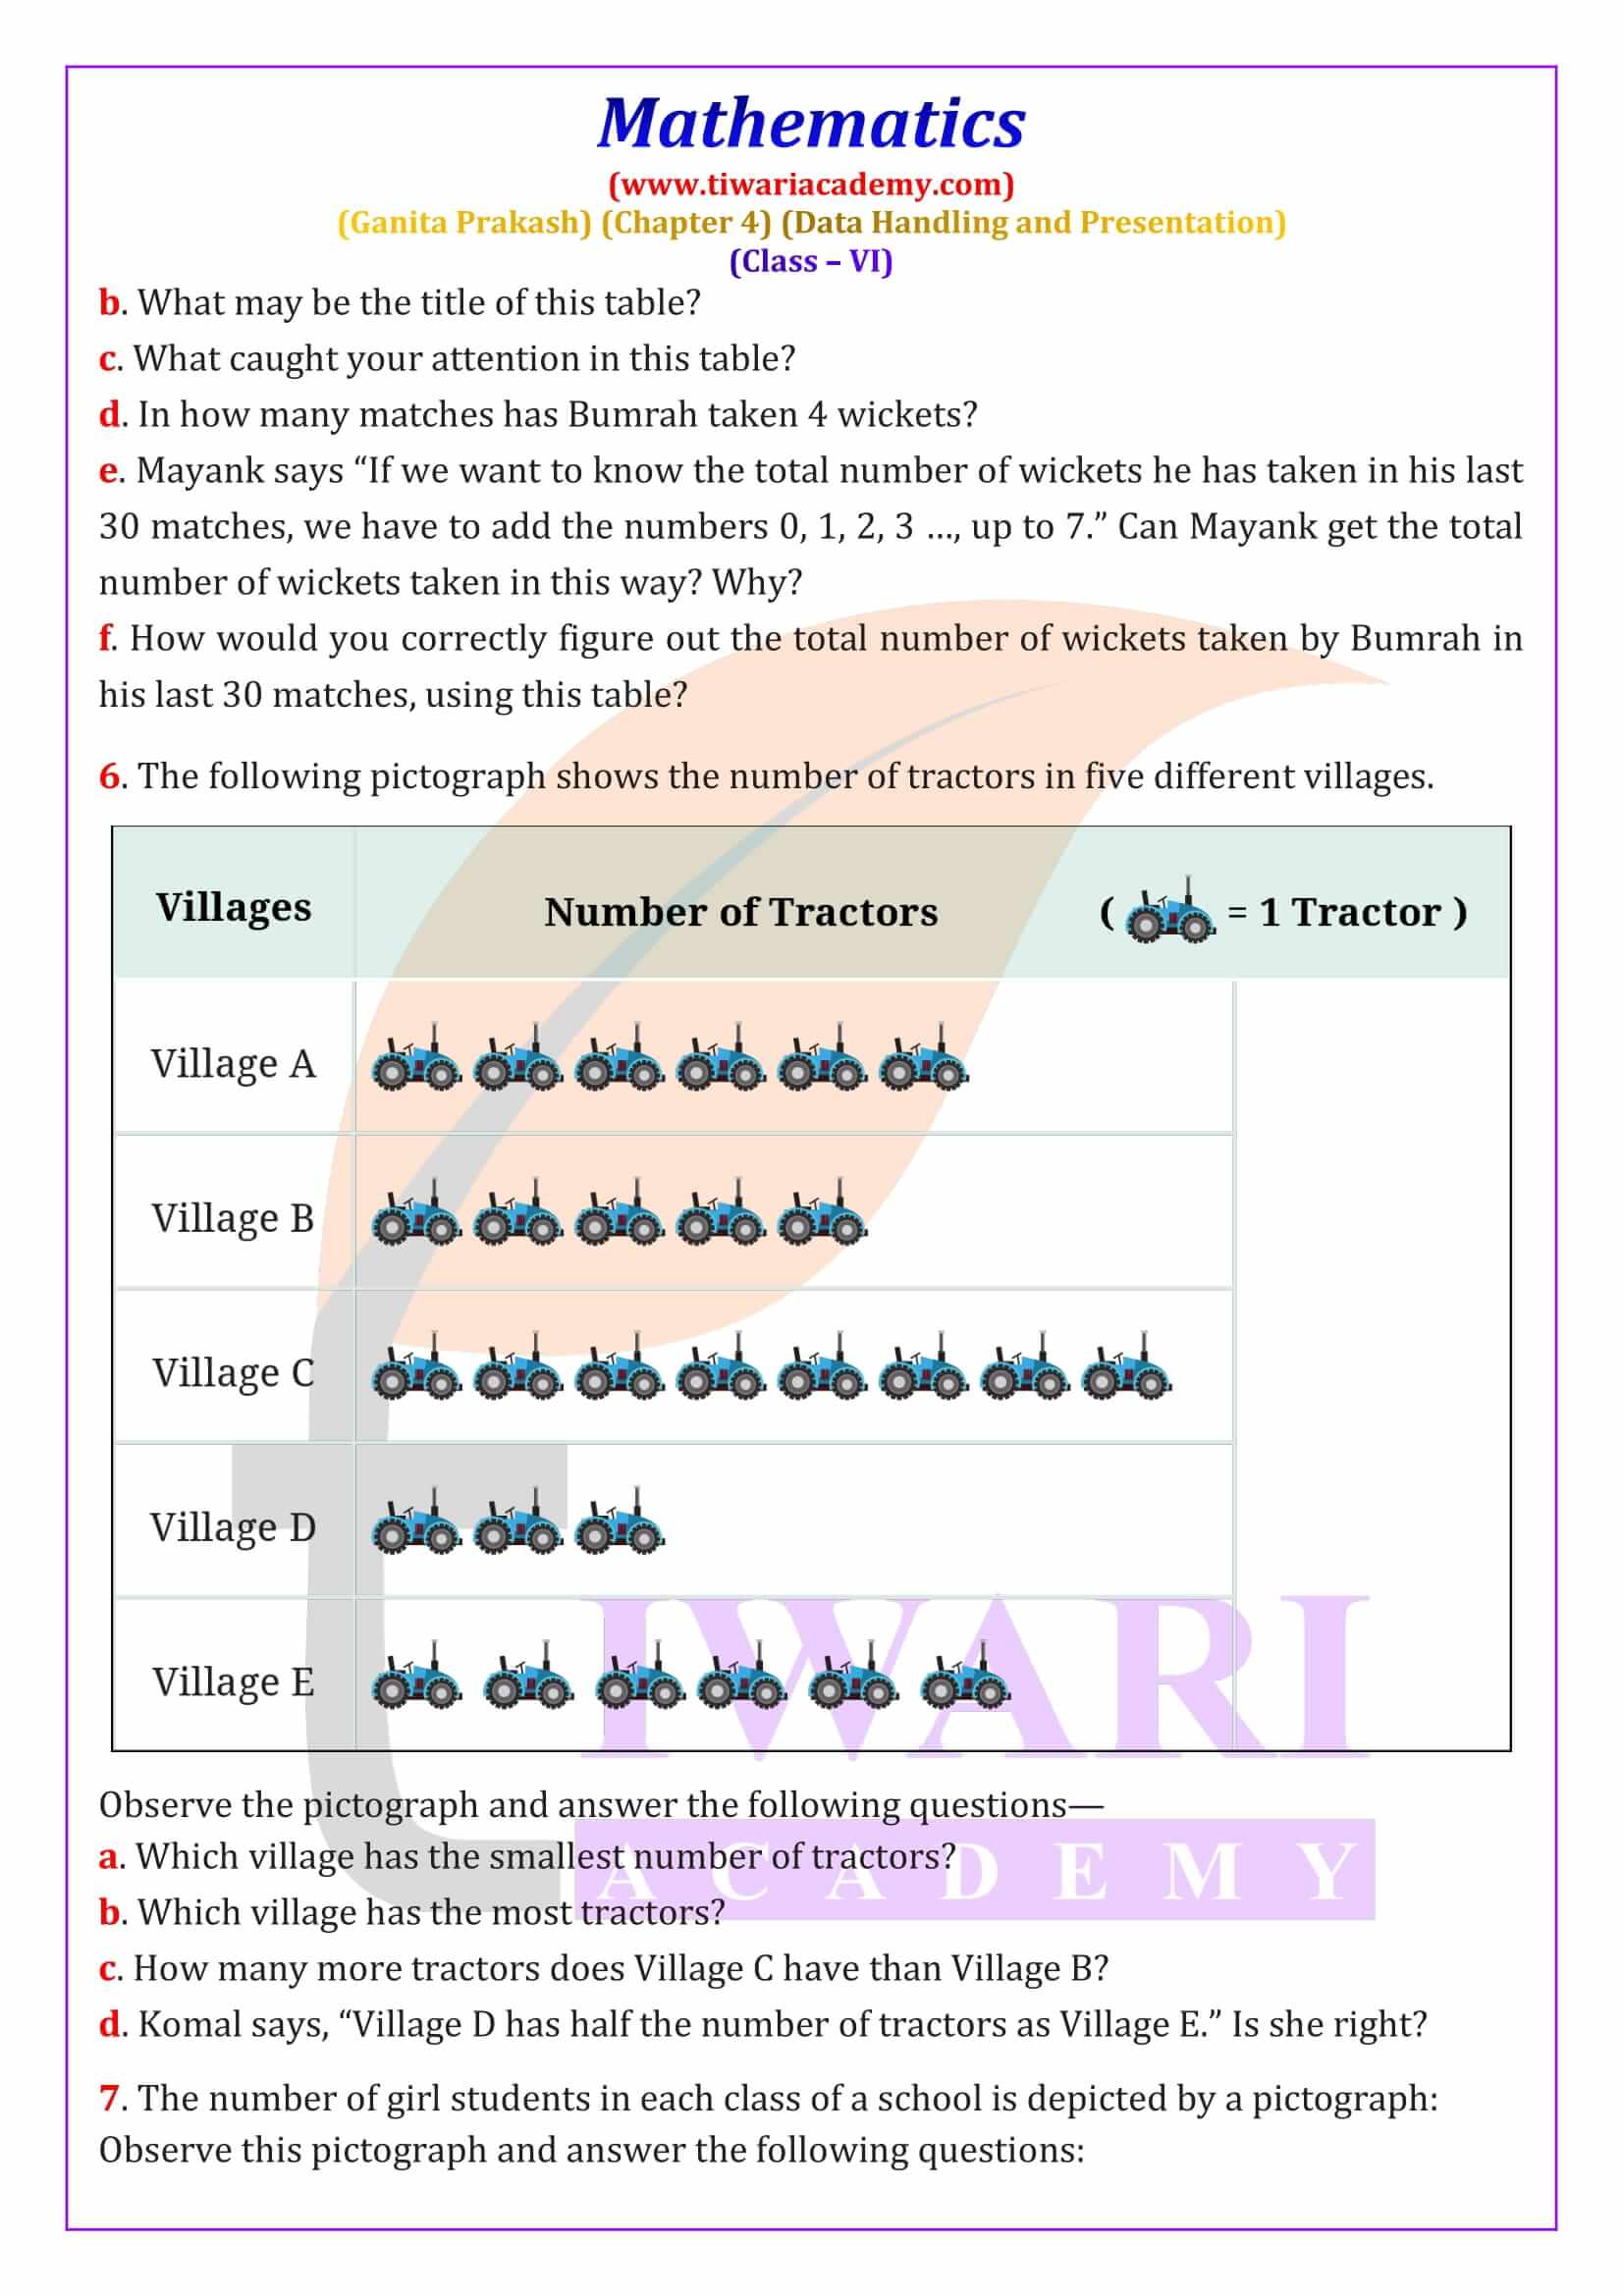
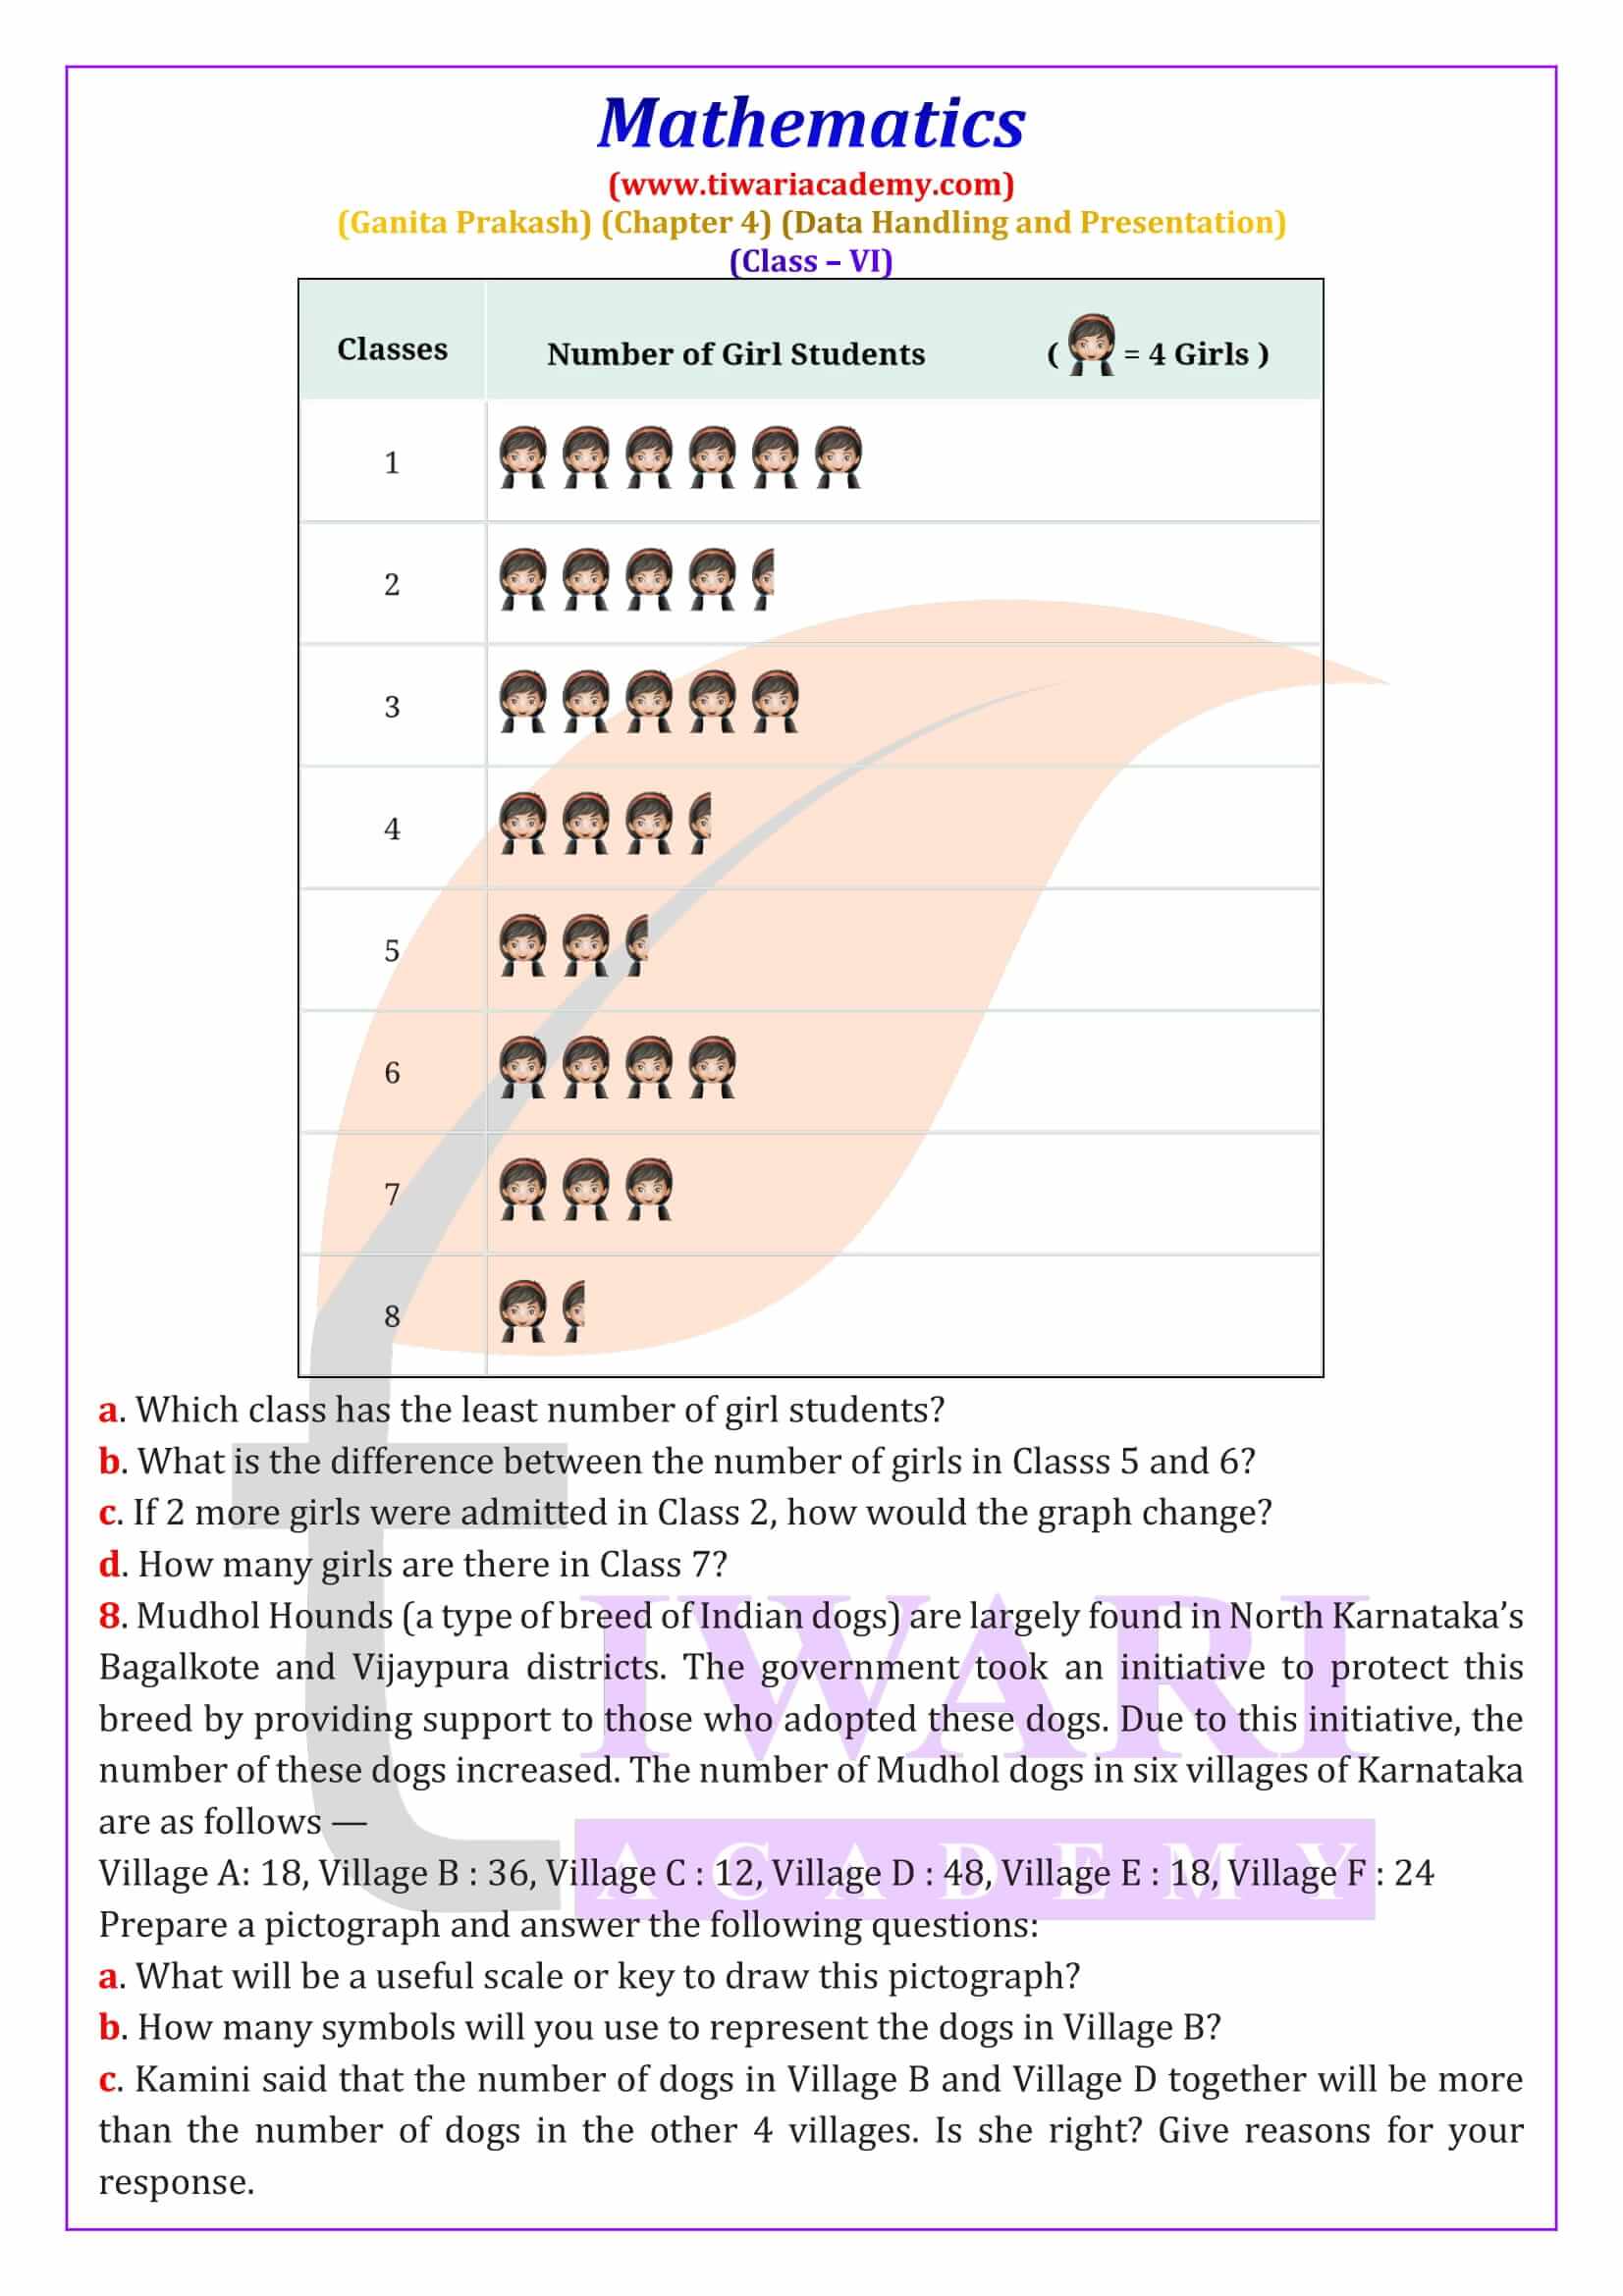
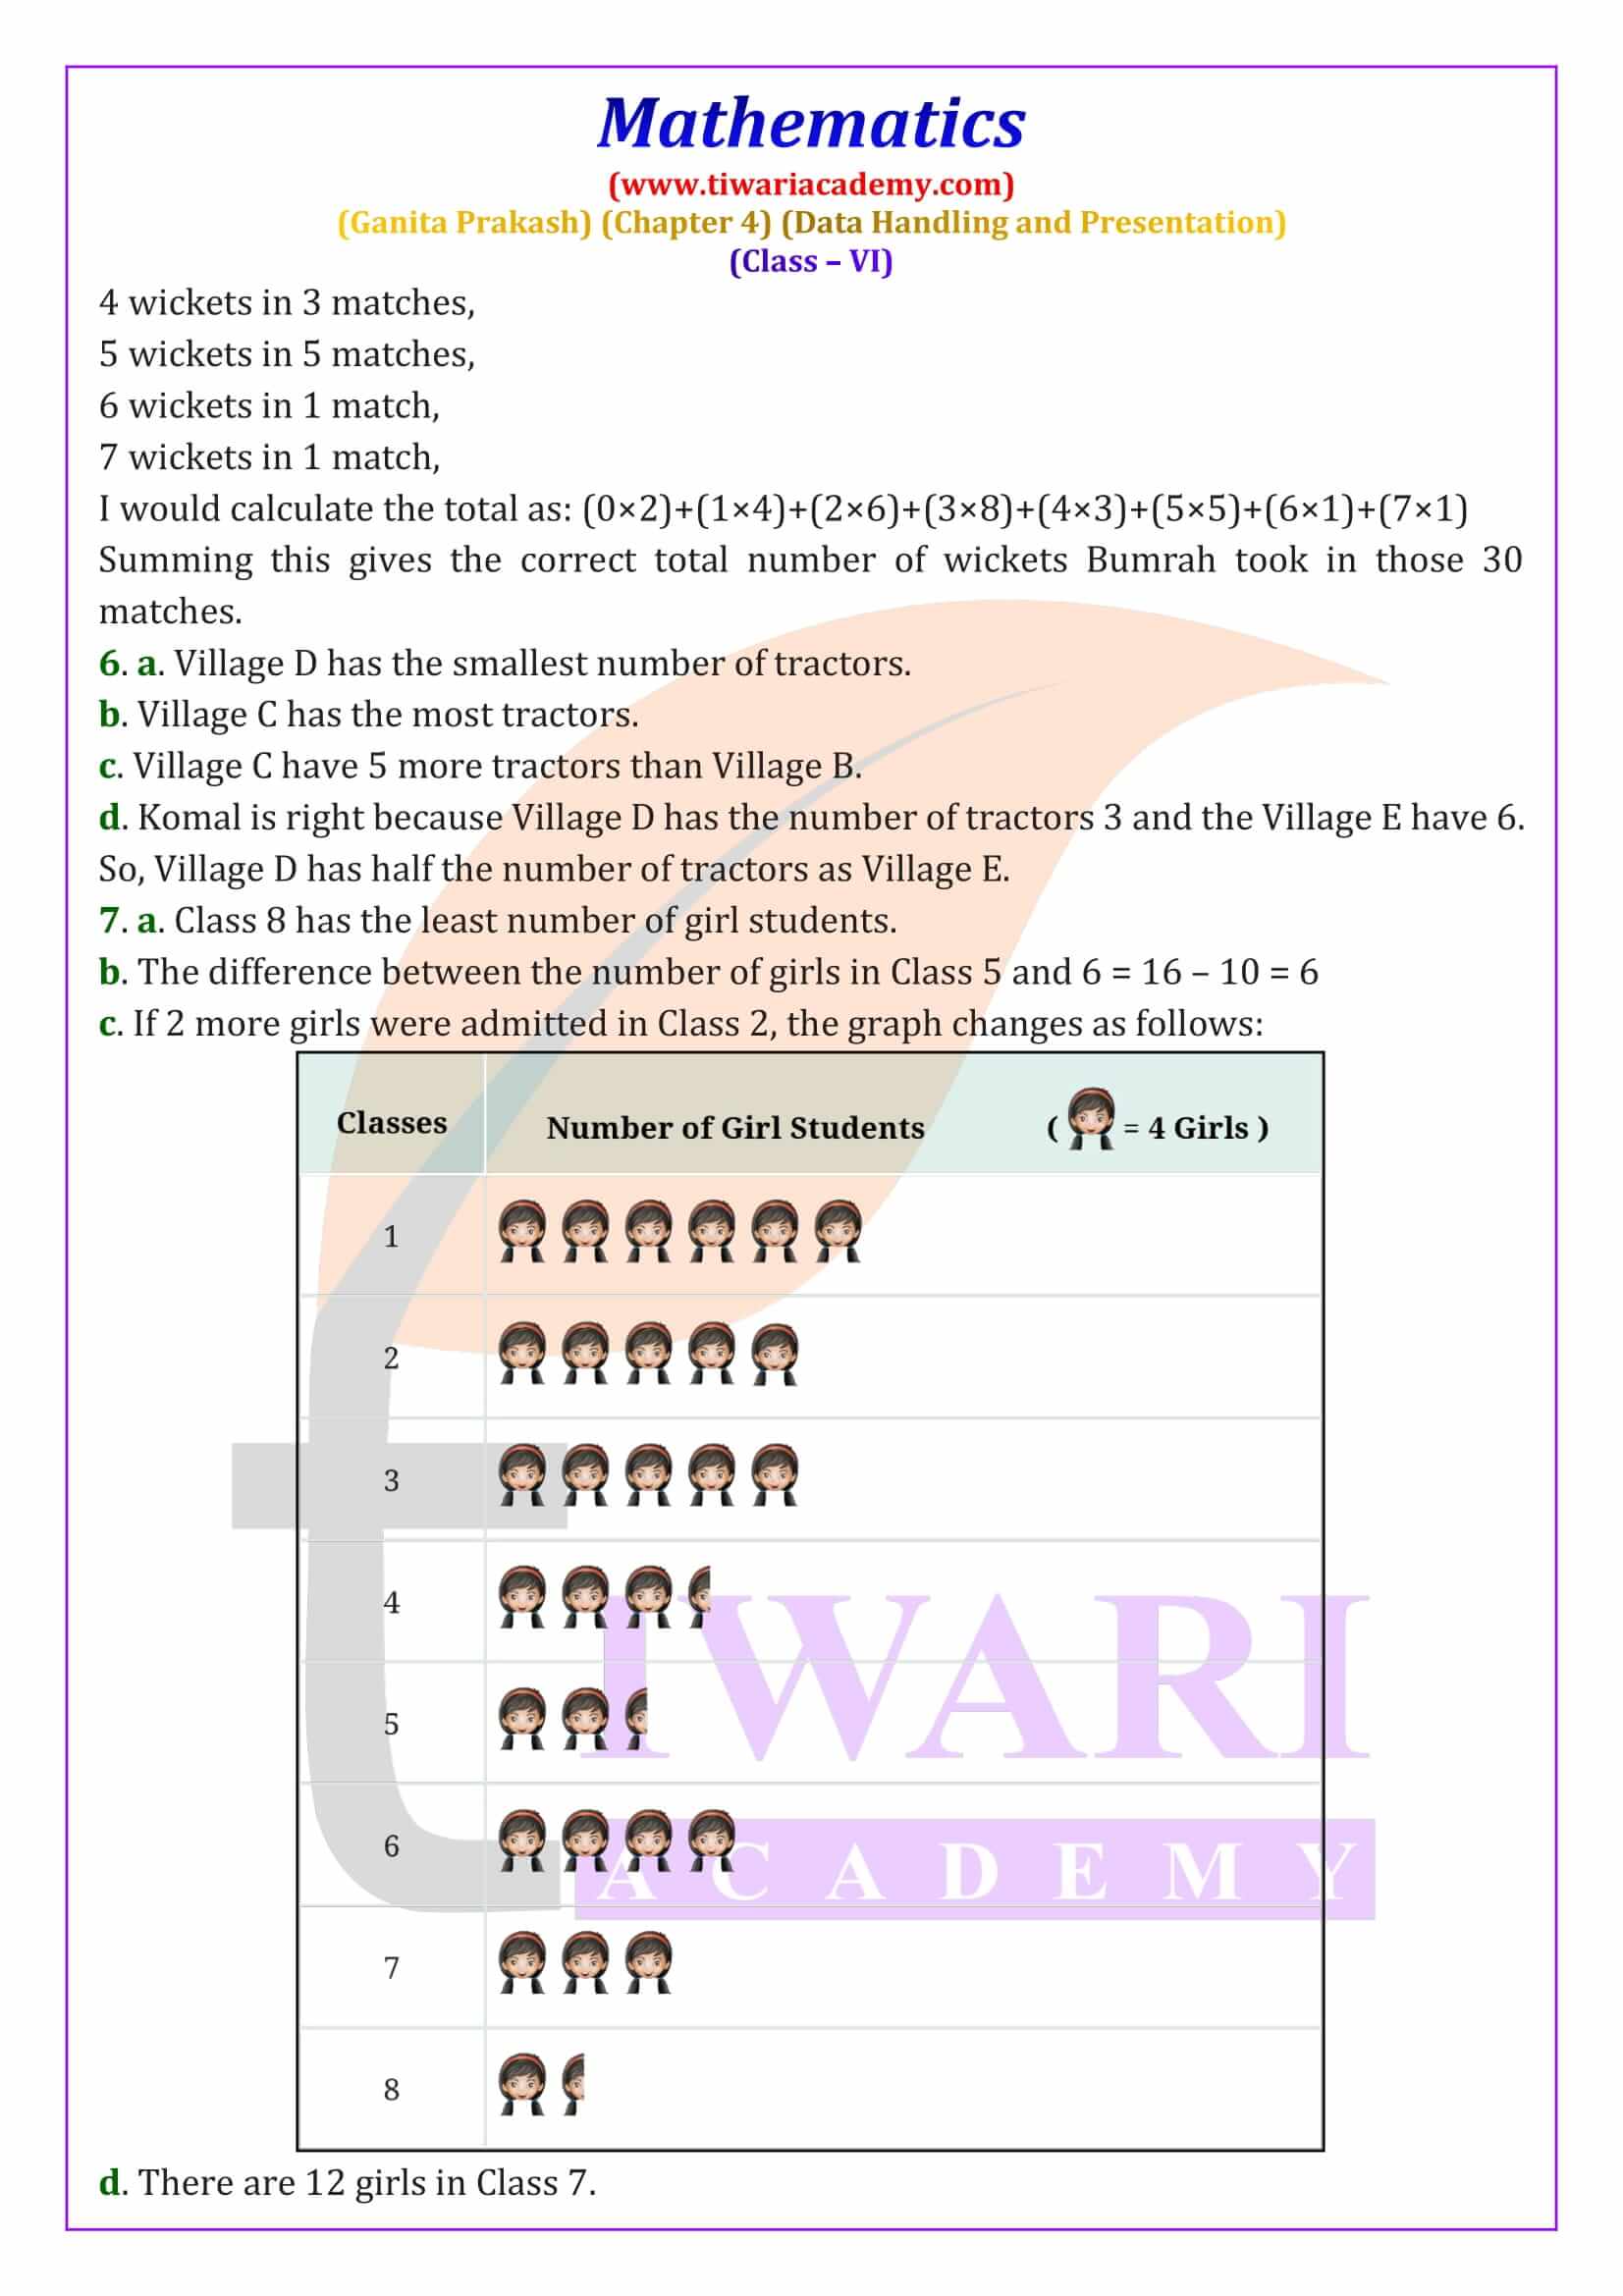
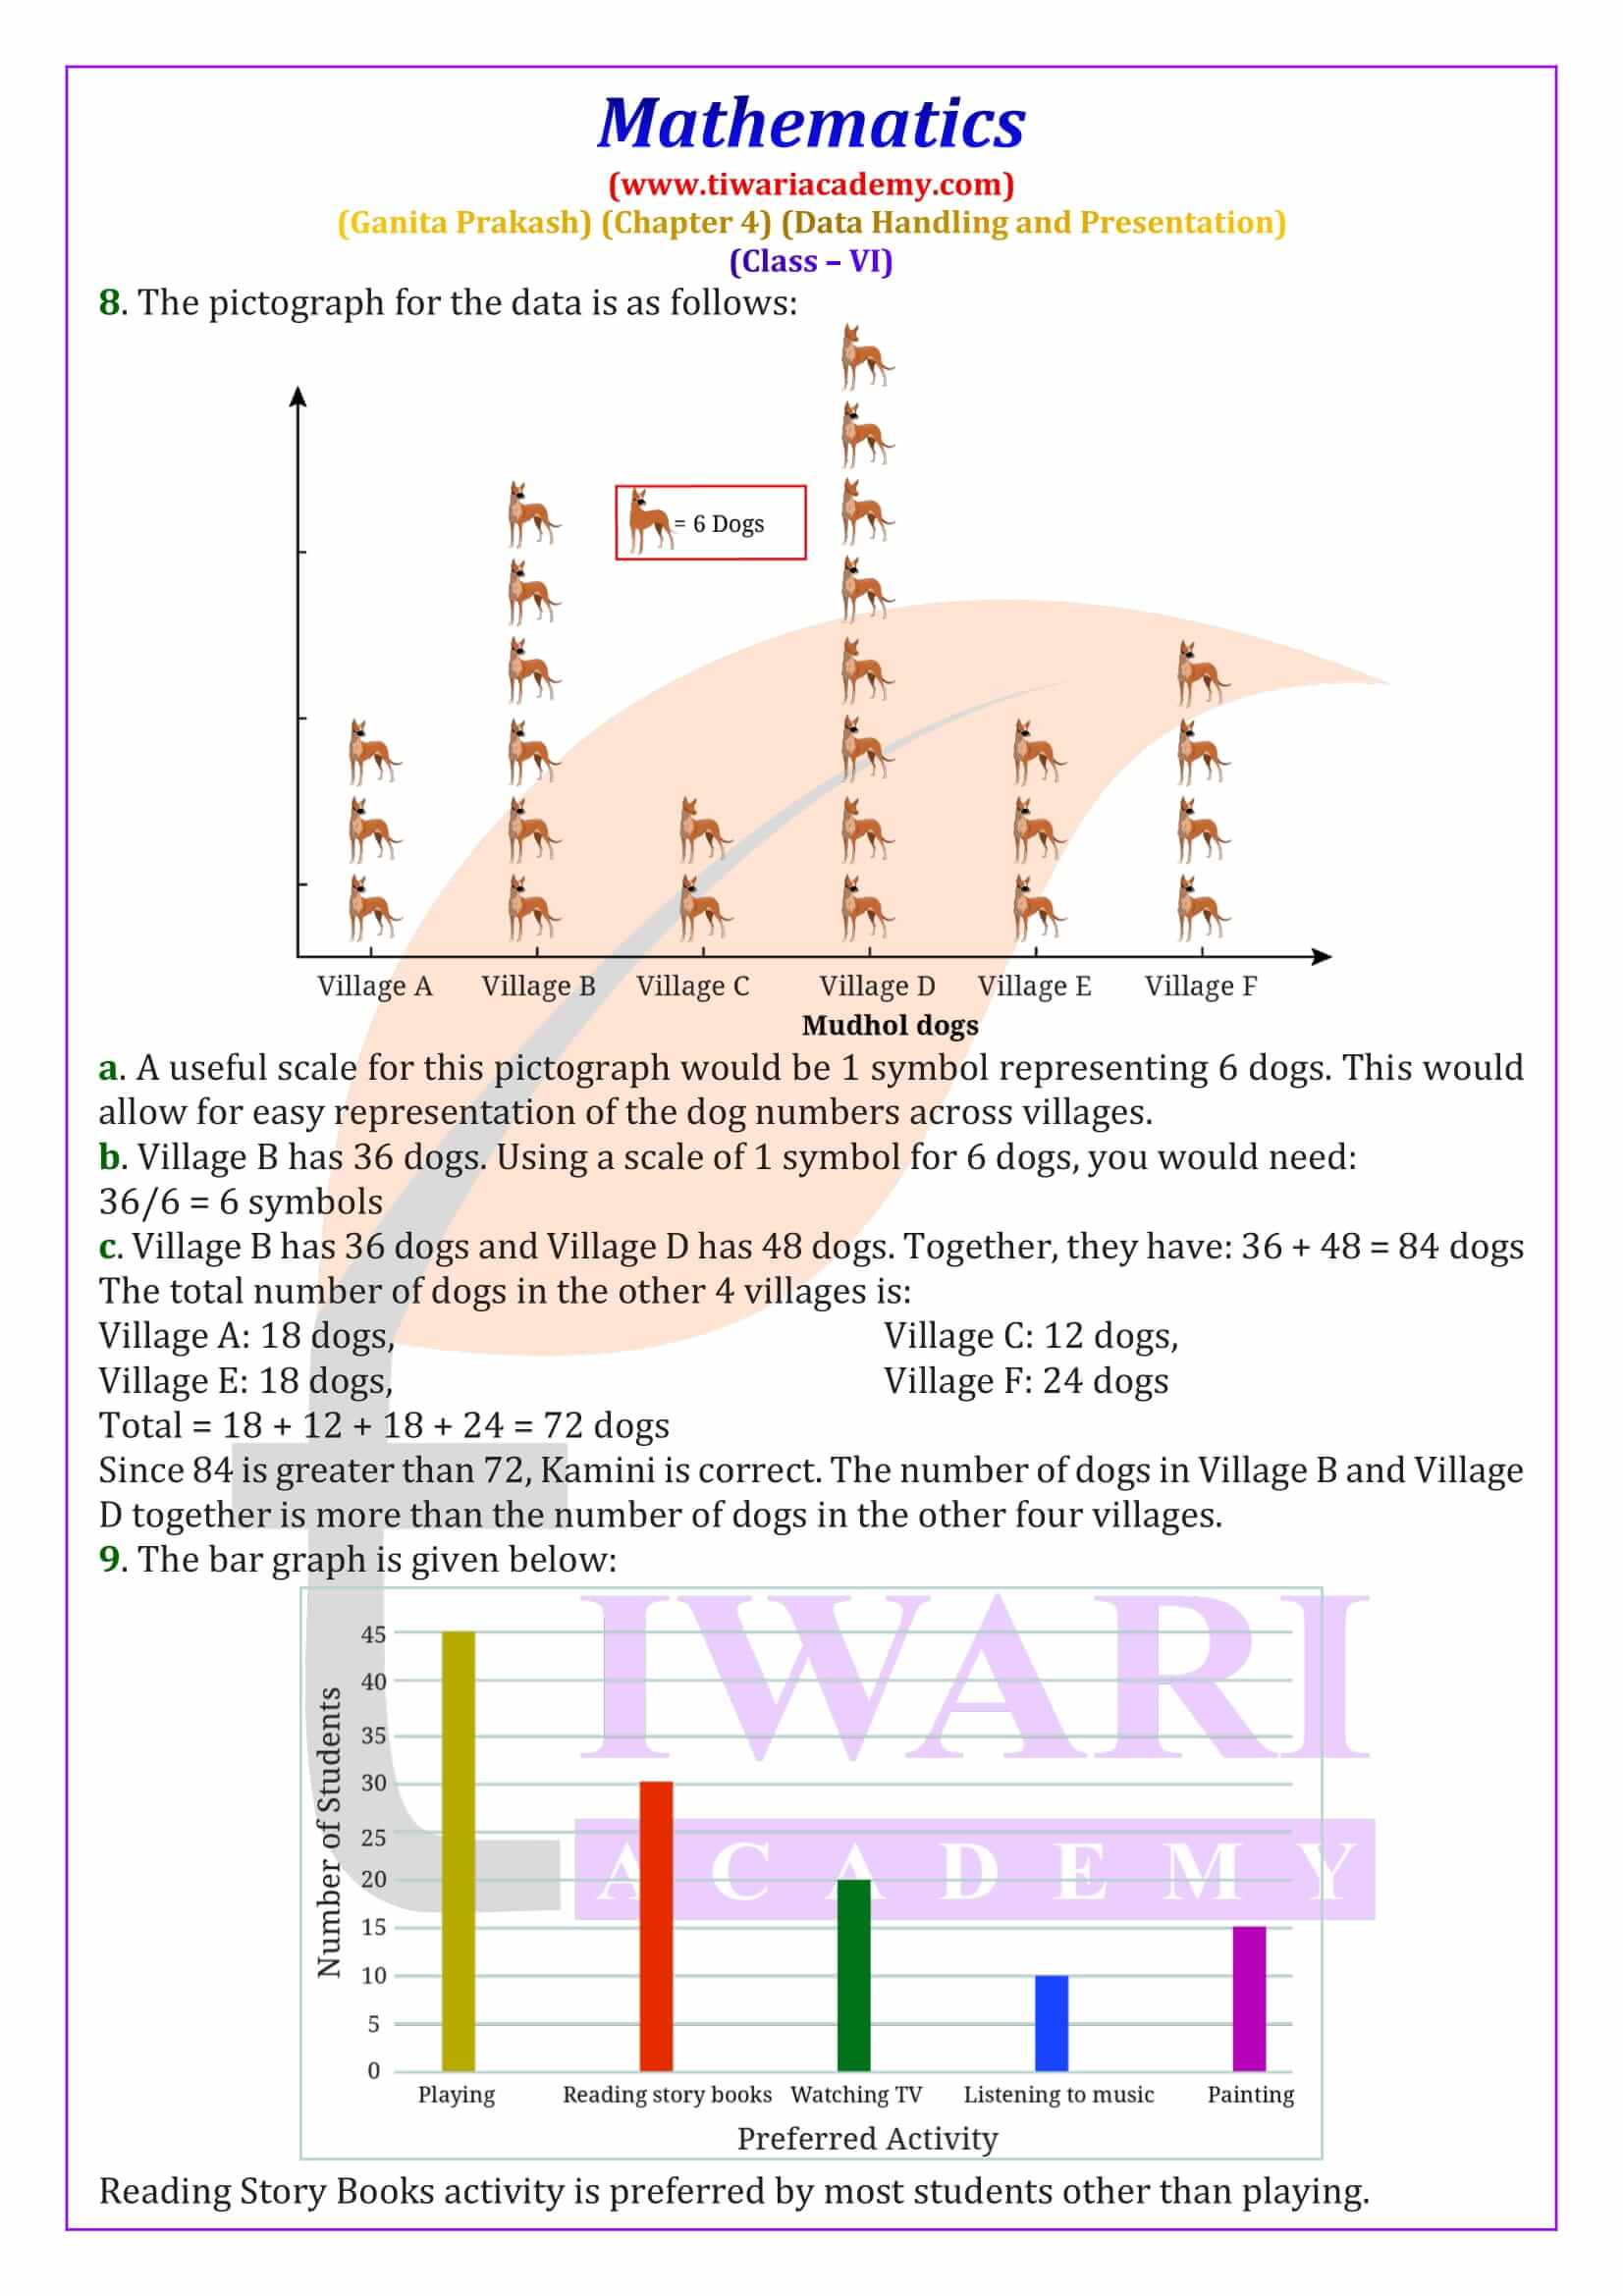
One fun way to represent data is by using pictographs. A pictograph uses symbols or pictures to show data. For example, if you want to show how students in your class travel to school, you can use pictures of bicycles, buses, or cars. Each picture can represent a certain number of students. It’s a quick and easy way to understand data. The chapter explains how to make and read pictographs and you can find examples and solutions on Tiwari Academy to practice.
Bar Graphs
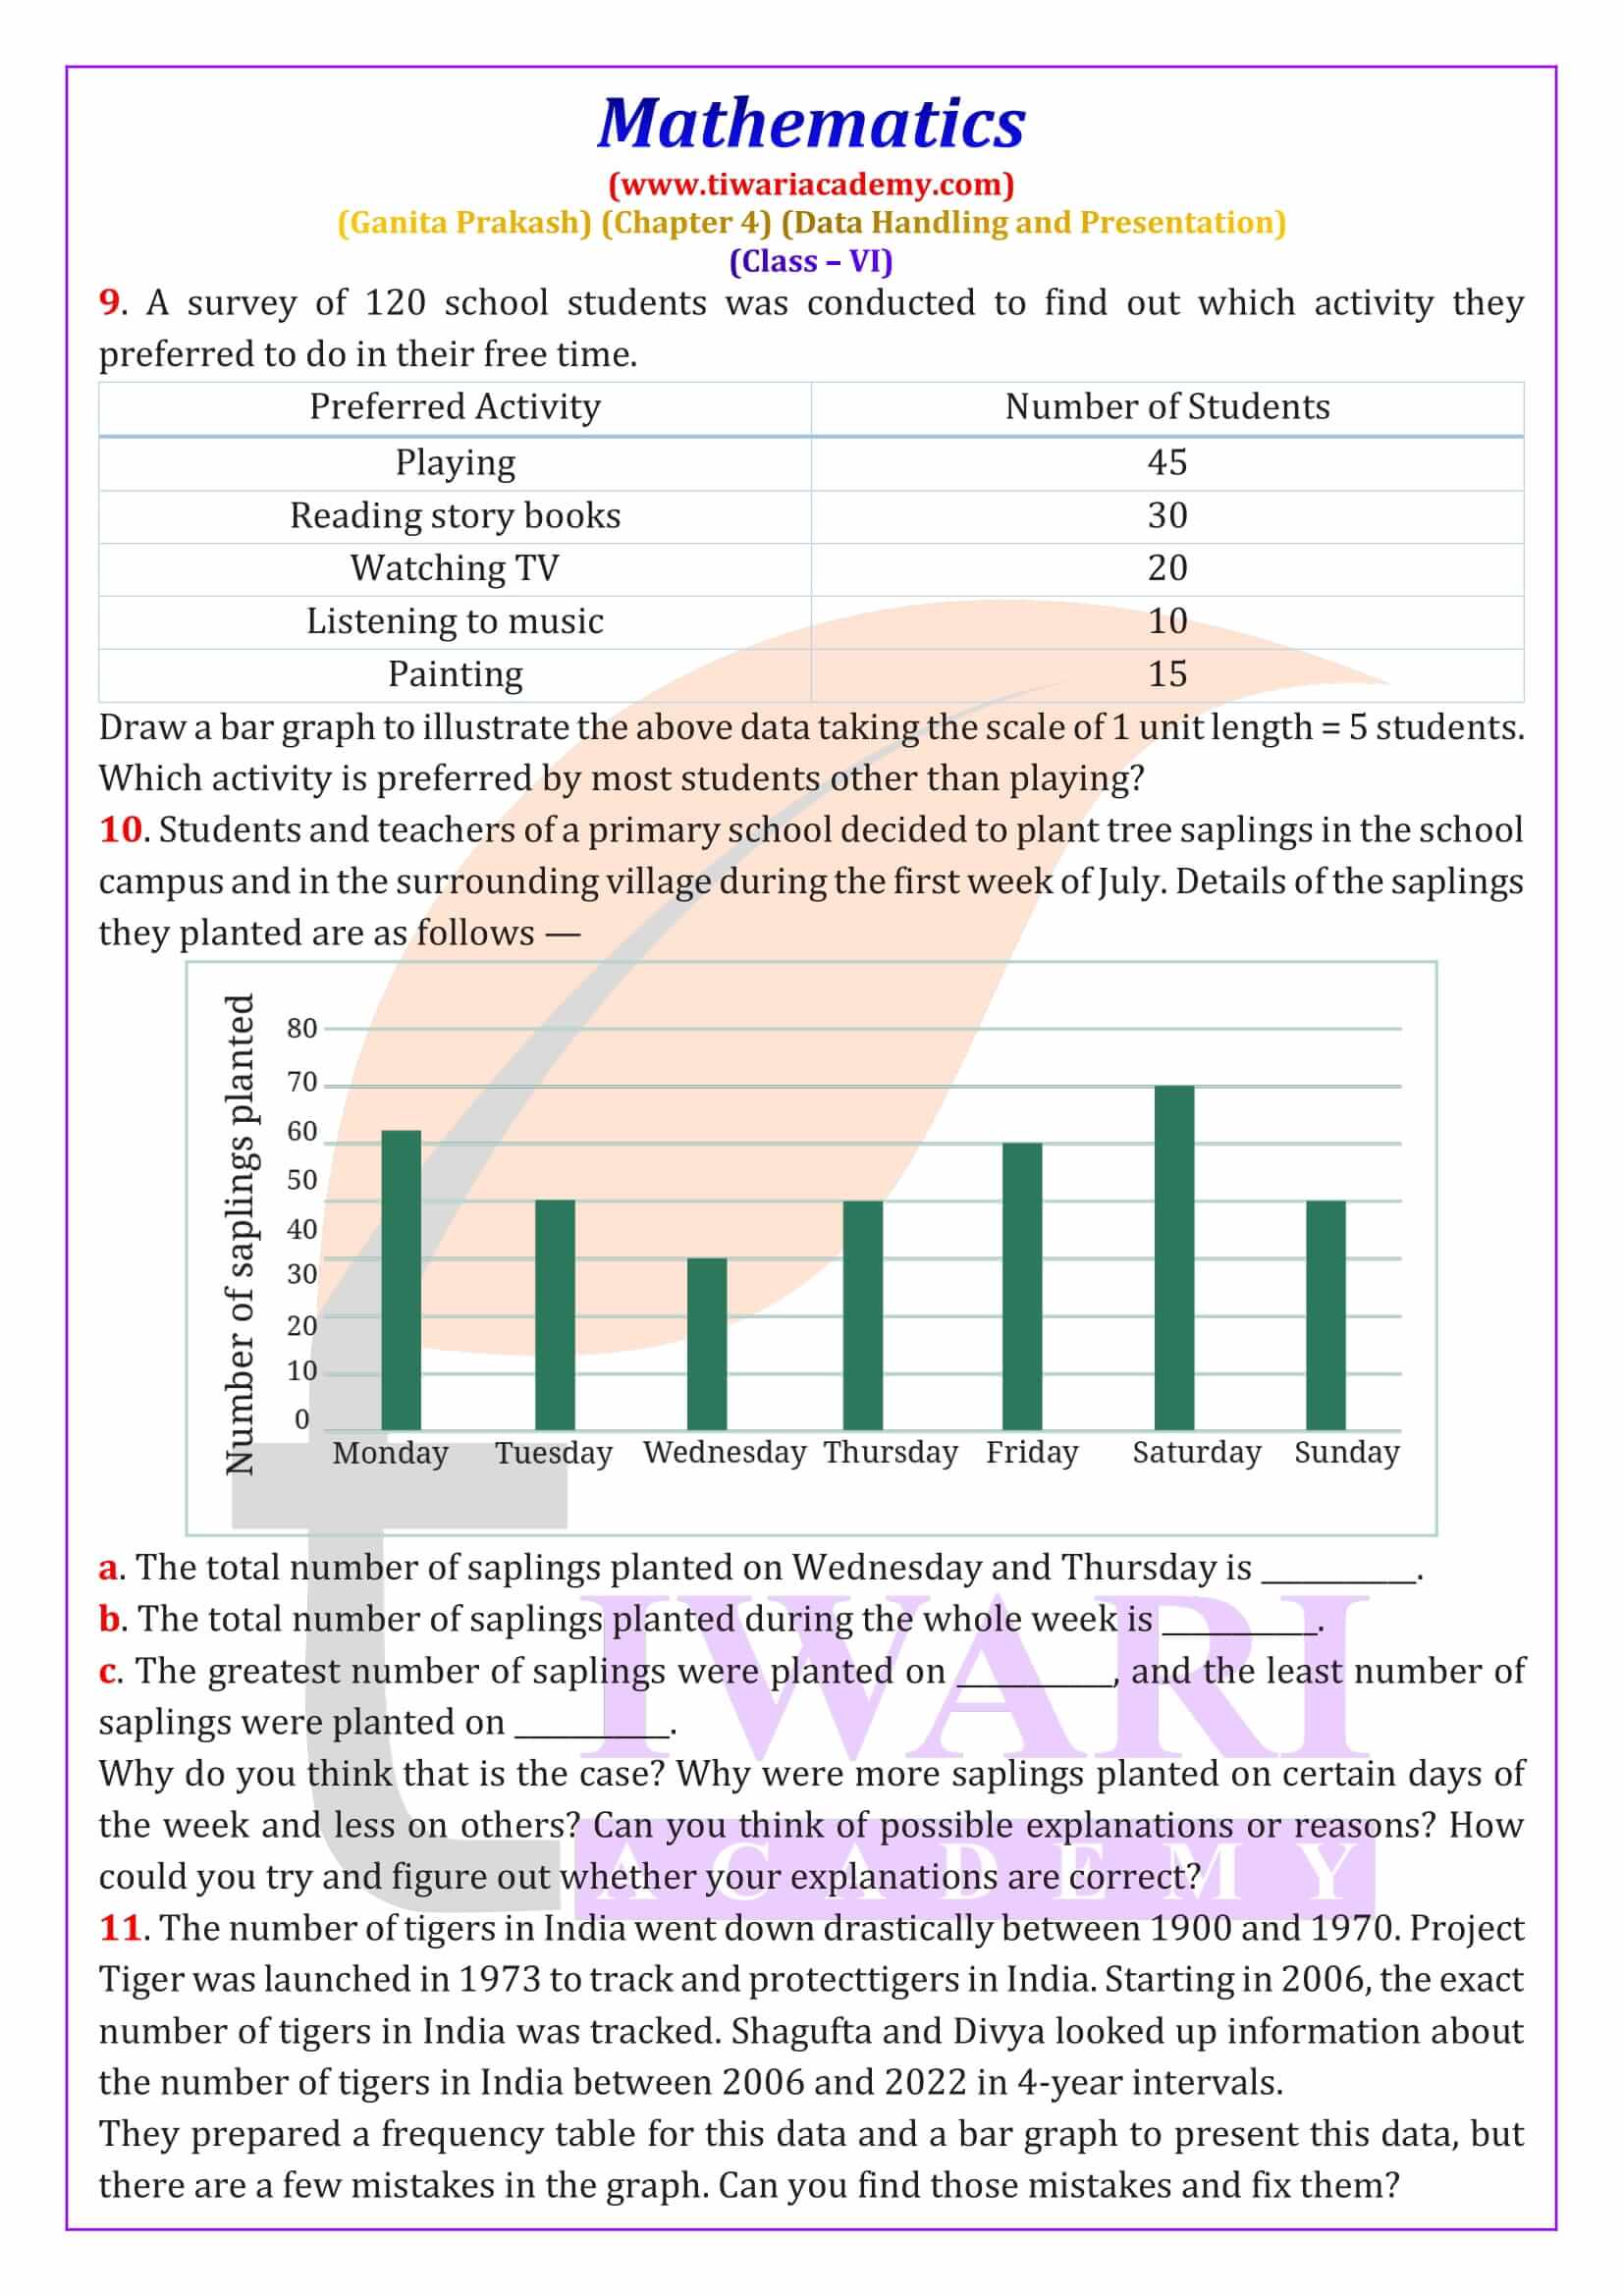
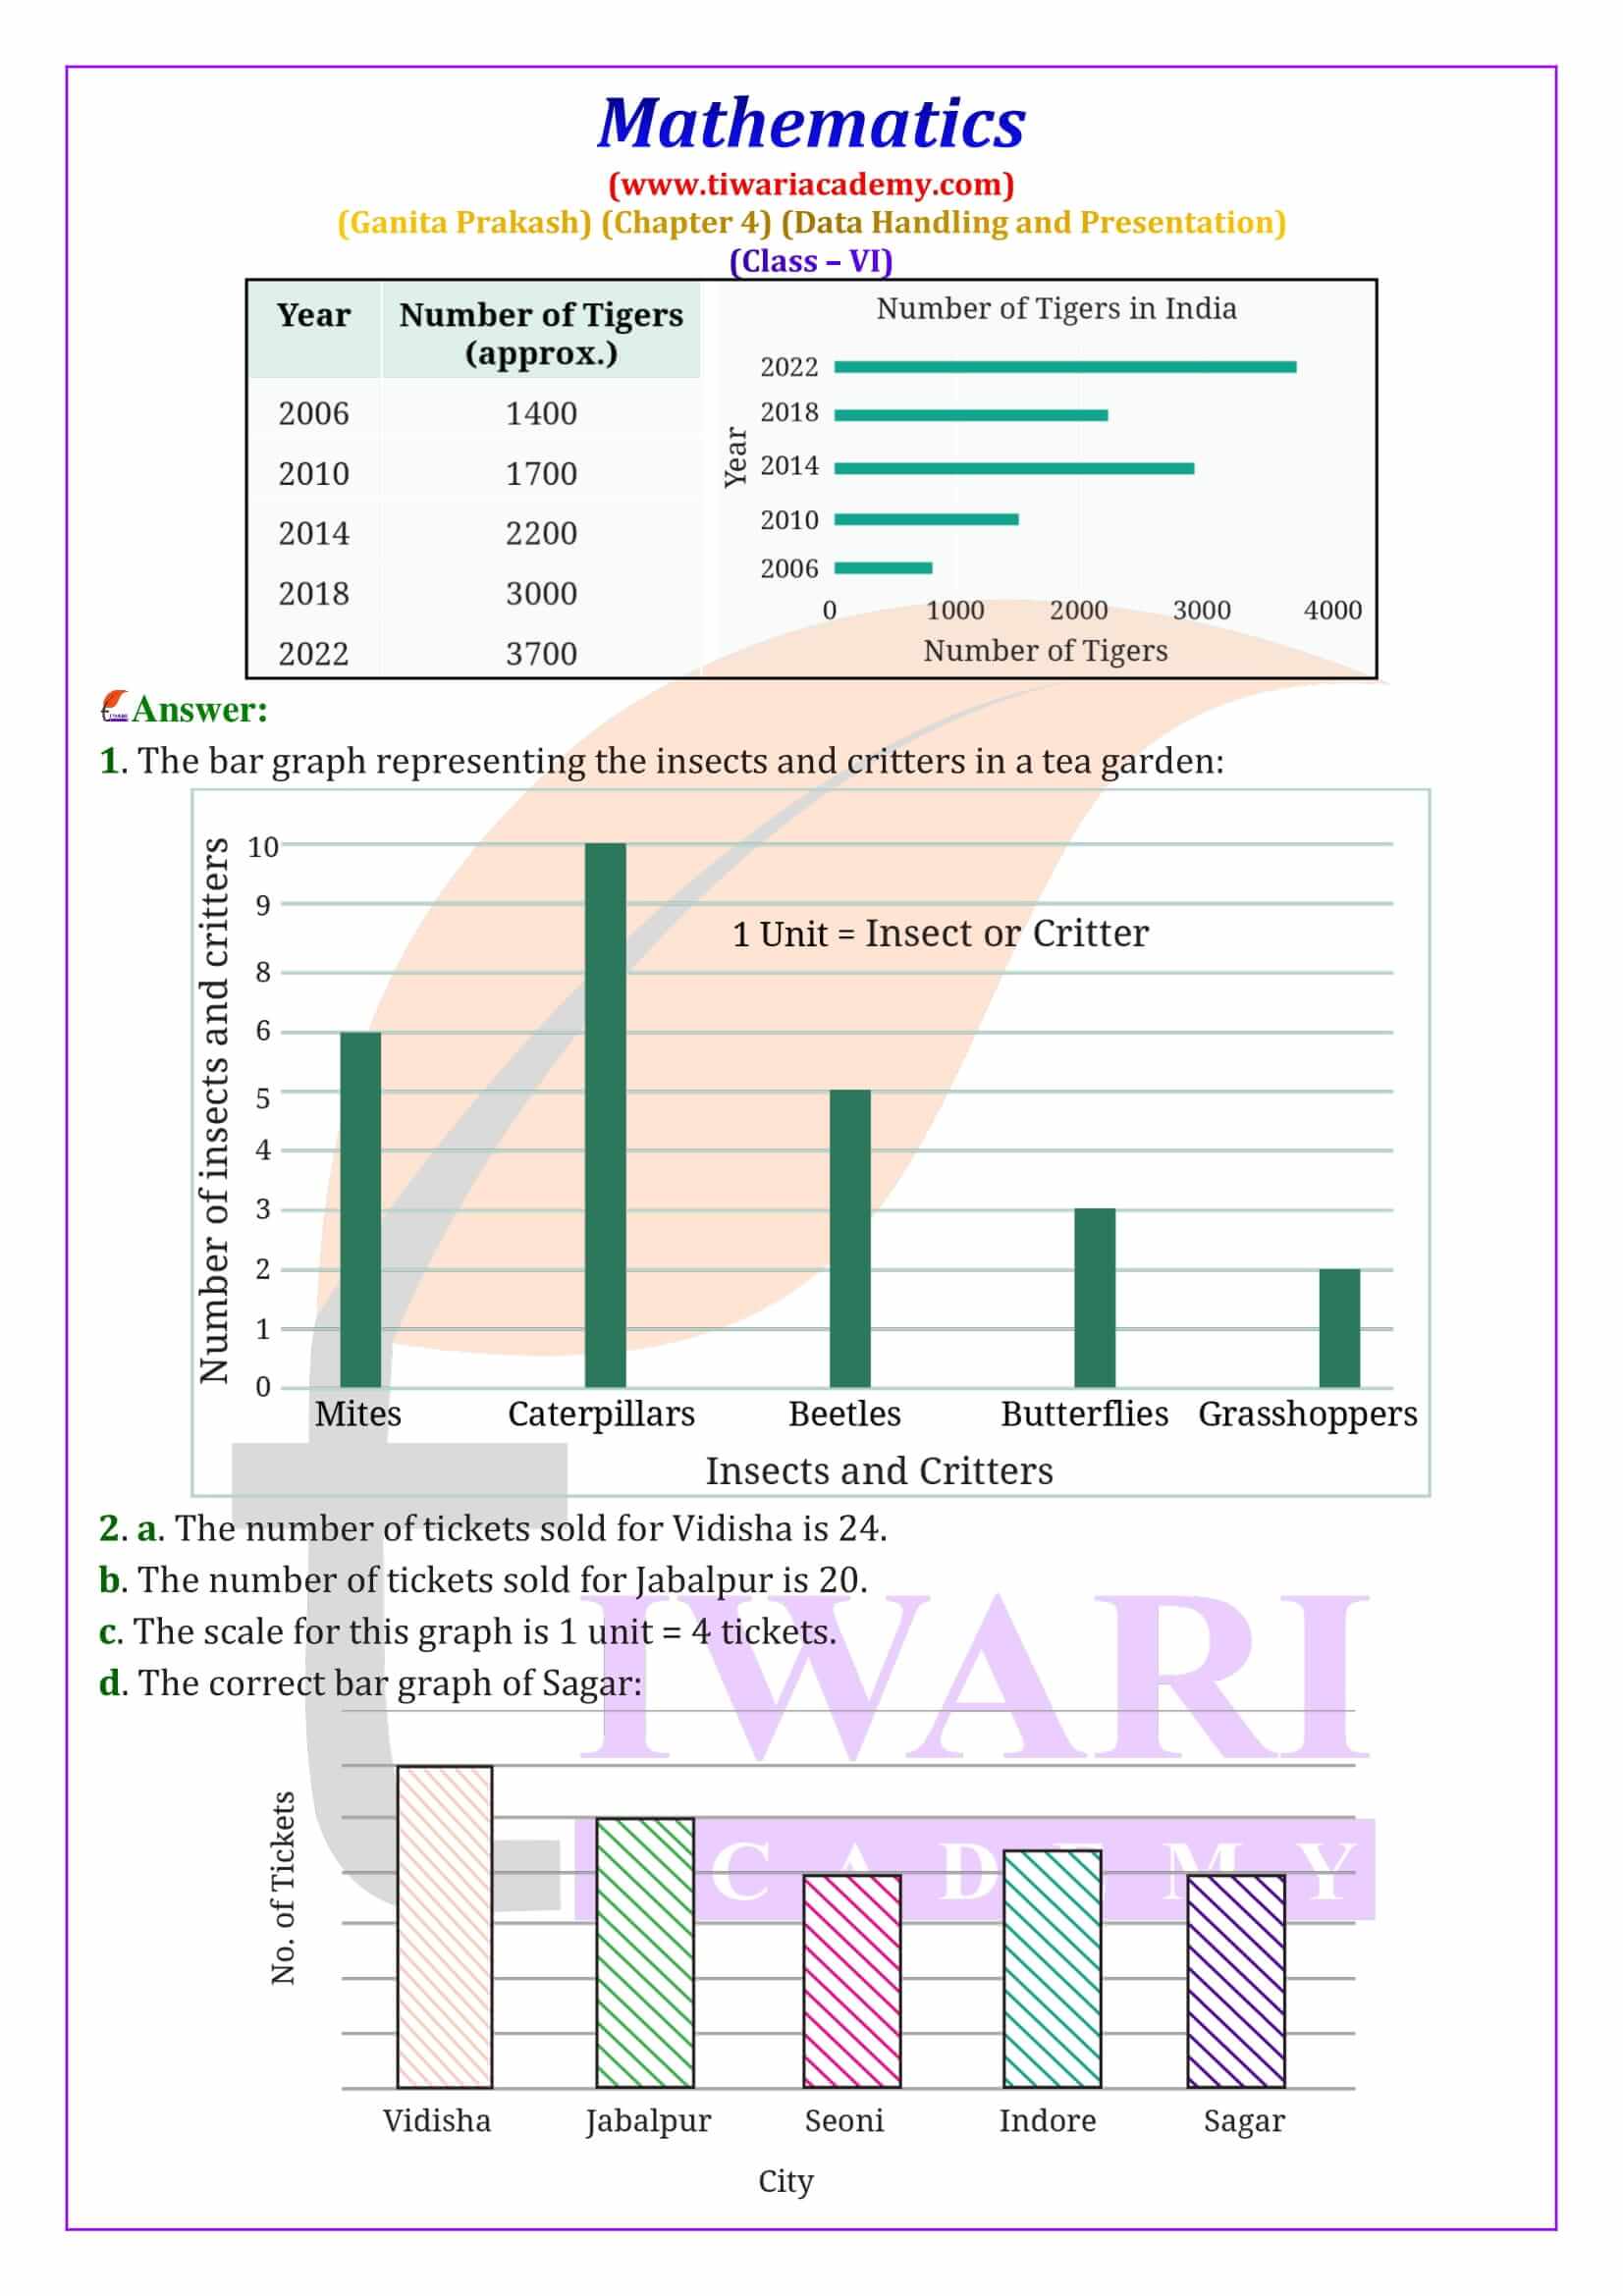
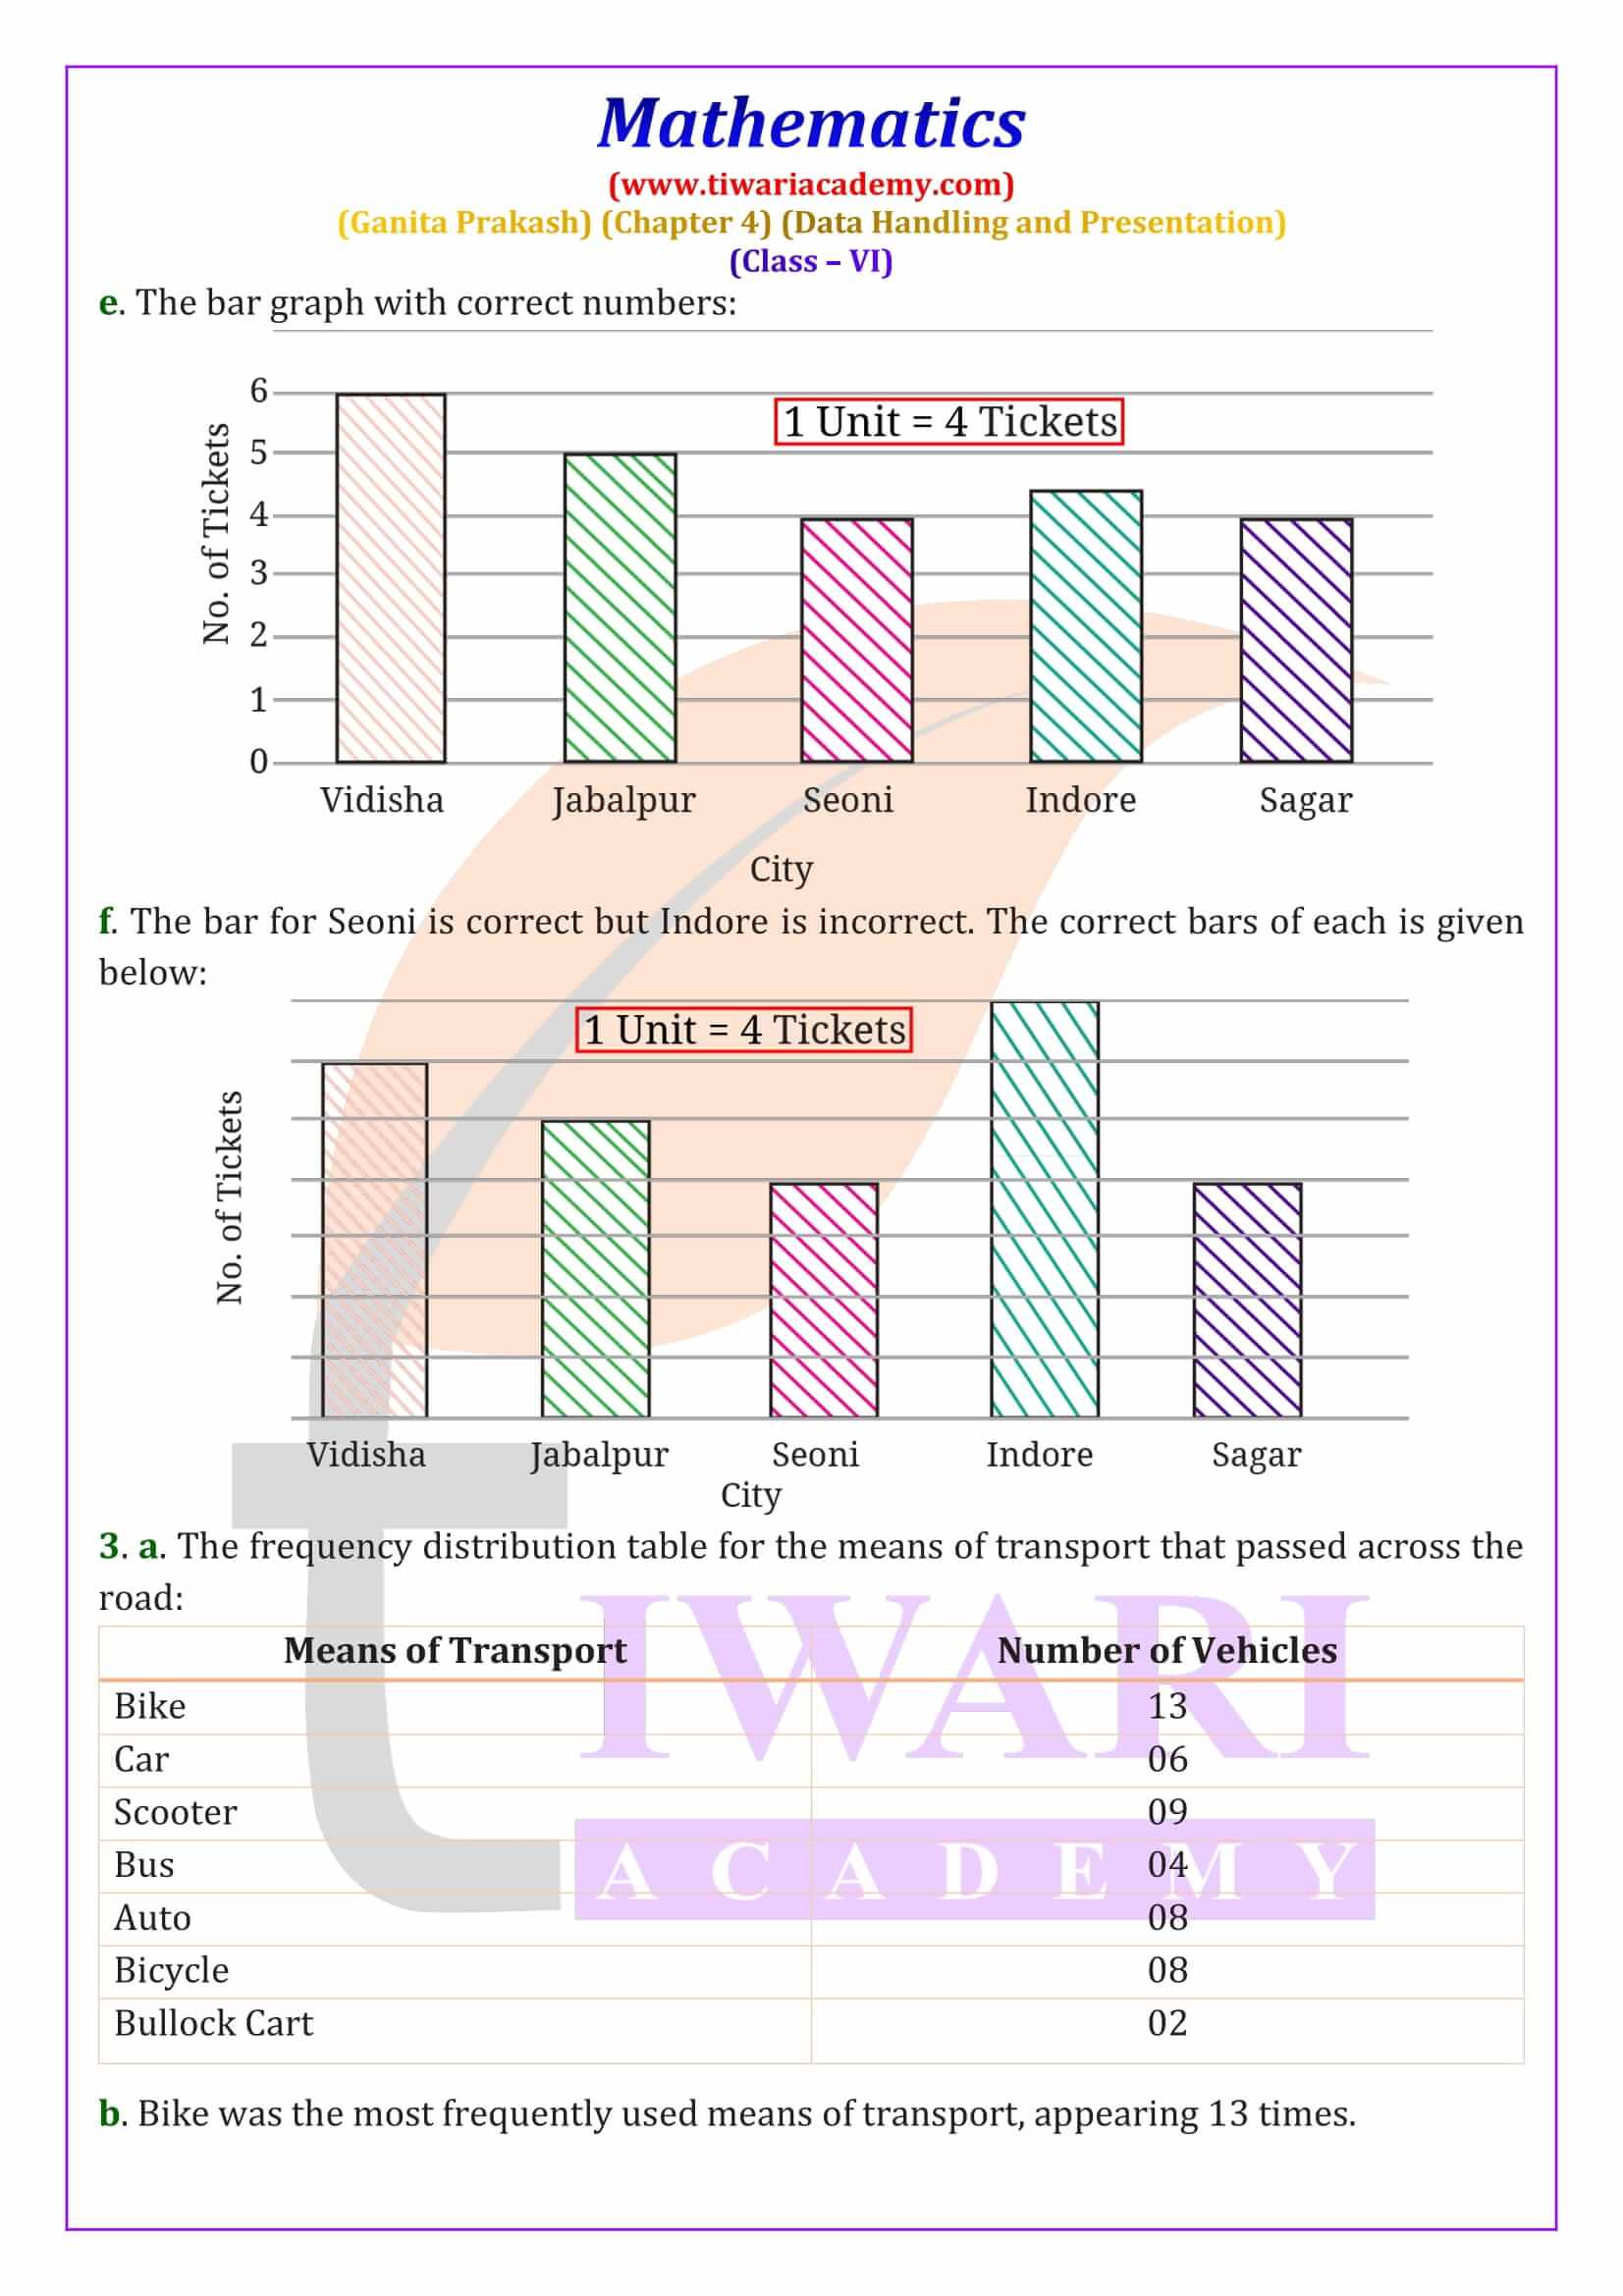
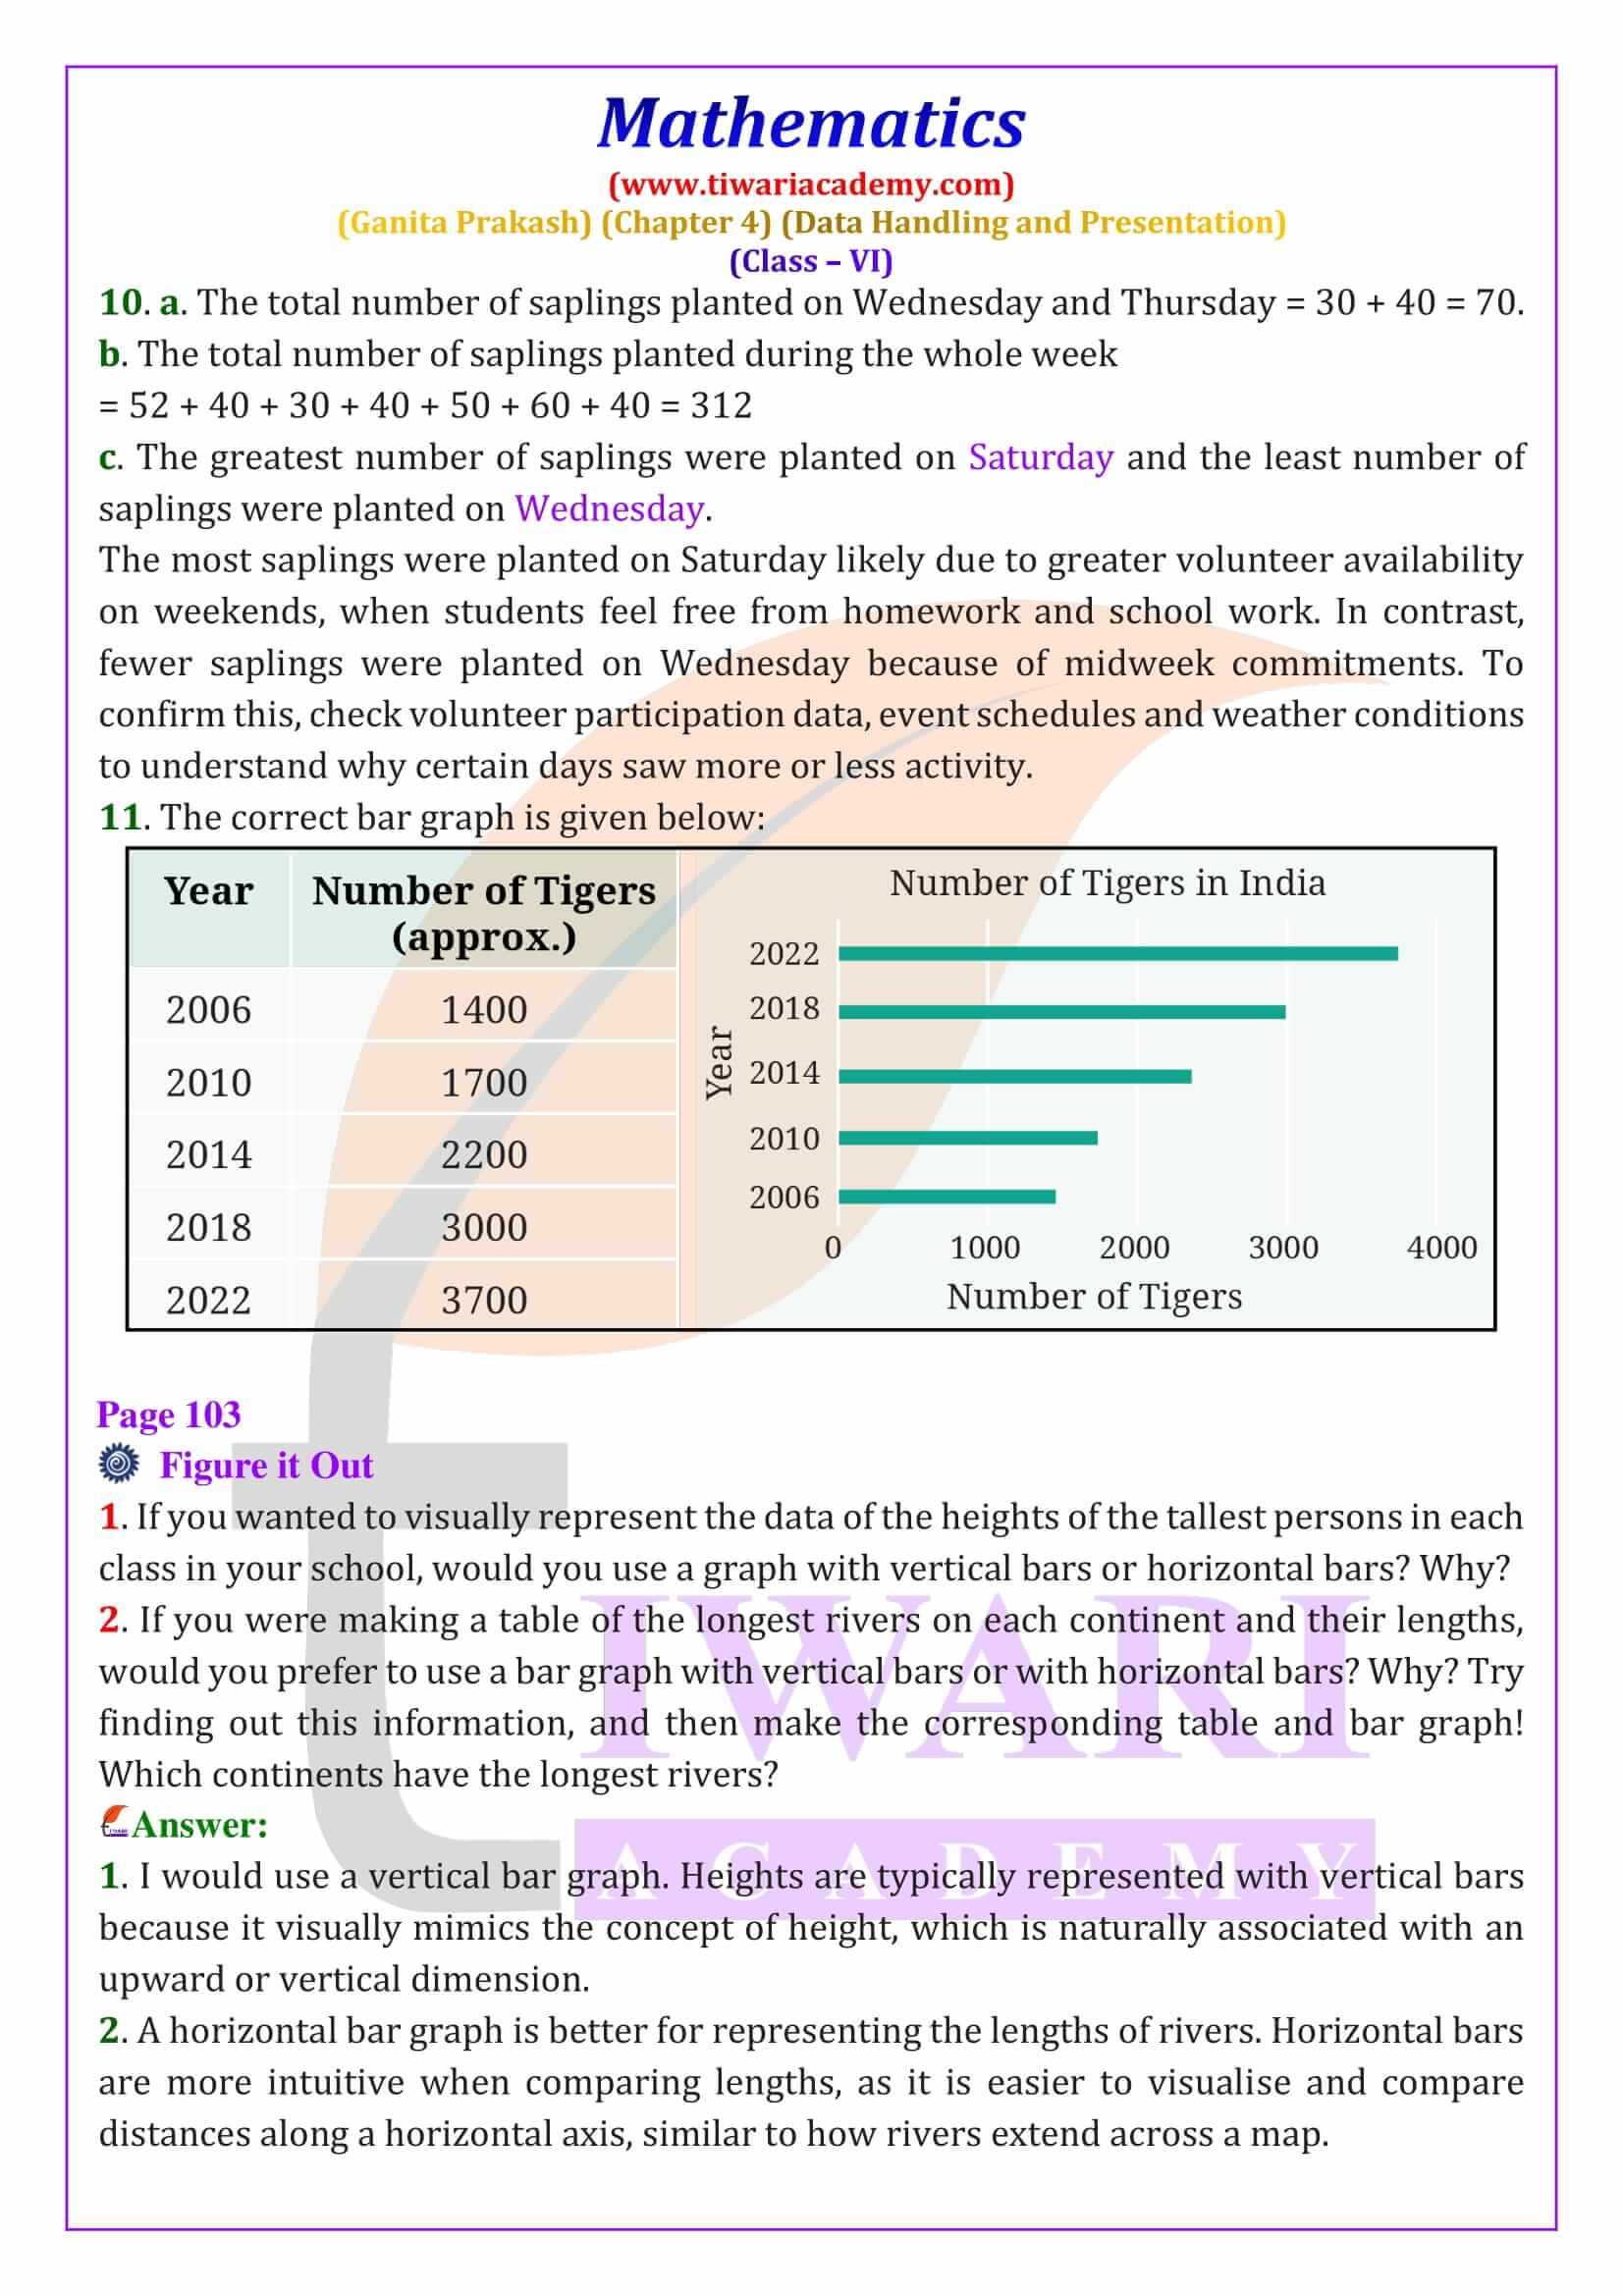
Sometimes, when the data is larger or more complex, a bar graph is a better option. Bar graphs use bars to show the amount or frequency of something. The longer the bar, the higher the number. For instance, you can use a bar graph to show how many students prefer cricket, football or badminton. Bar graphs make it easy to compare data. Learn how to draw and interpret bar graphs with the help of NCERT solutions available on Tiwari Academy.
Interpreting Data
Understanding data isn’t just about collecting and organizing it, but also about interpreting it. Why were more books borrowed on Saturday than Wednesday? Why do people watch more TV during weekends? These are the kinds of questions you can answer by looking at data closely. This chapter helps you develop these critical thinking skills, and the solutions on Tiwari Academy guide you through the process with clear examples.
Solving Real-Life Problems
Data isn’t just something you learn in math class; it’s used everywhere, from businesses to sports. By learning how to handle data, you can solve real-world problems. For example, how can a store owner decide which products to stock more of? By looking at sales data, of course! This chapter connects what you learn to real-life situations, making it practical and useful. To explore more real-life problems, you can use the detailed solutions from Tiwari Academy.
By the end of this chapter, you’ll be able to collect data, organize it, and present it using pictographs and bar graphs. You’ll also be able to interpret data and make sense of the world around you. The solutions on Tiwari Academy will help you complete your exercises and give you additional practice to master these concepts. Make sure to visit their site for the best NCERT solutions to enhance your understanding of data handling and presentation!
Is Class 6 Maths Ganit Prakash chapter 4 difficult?
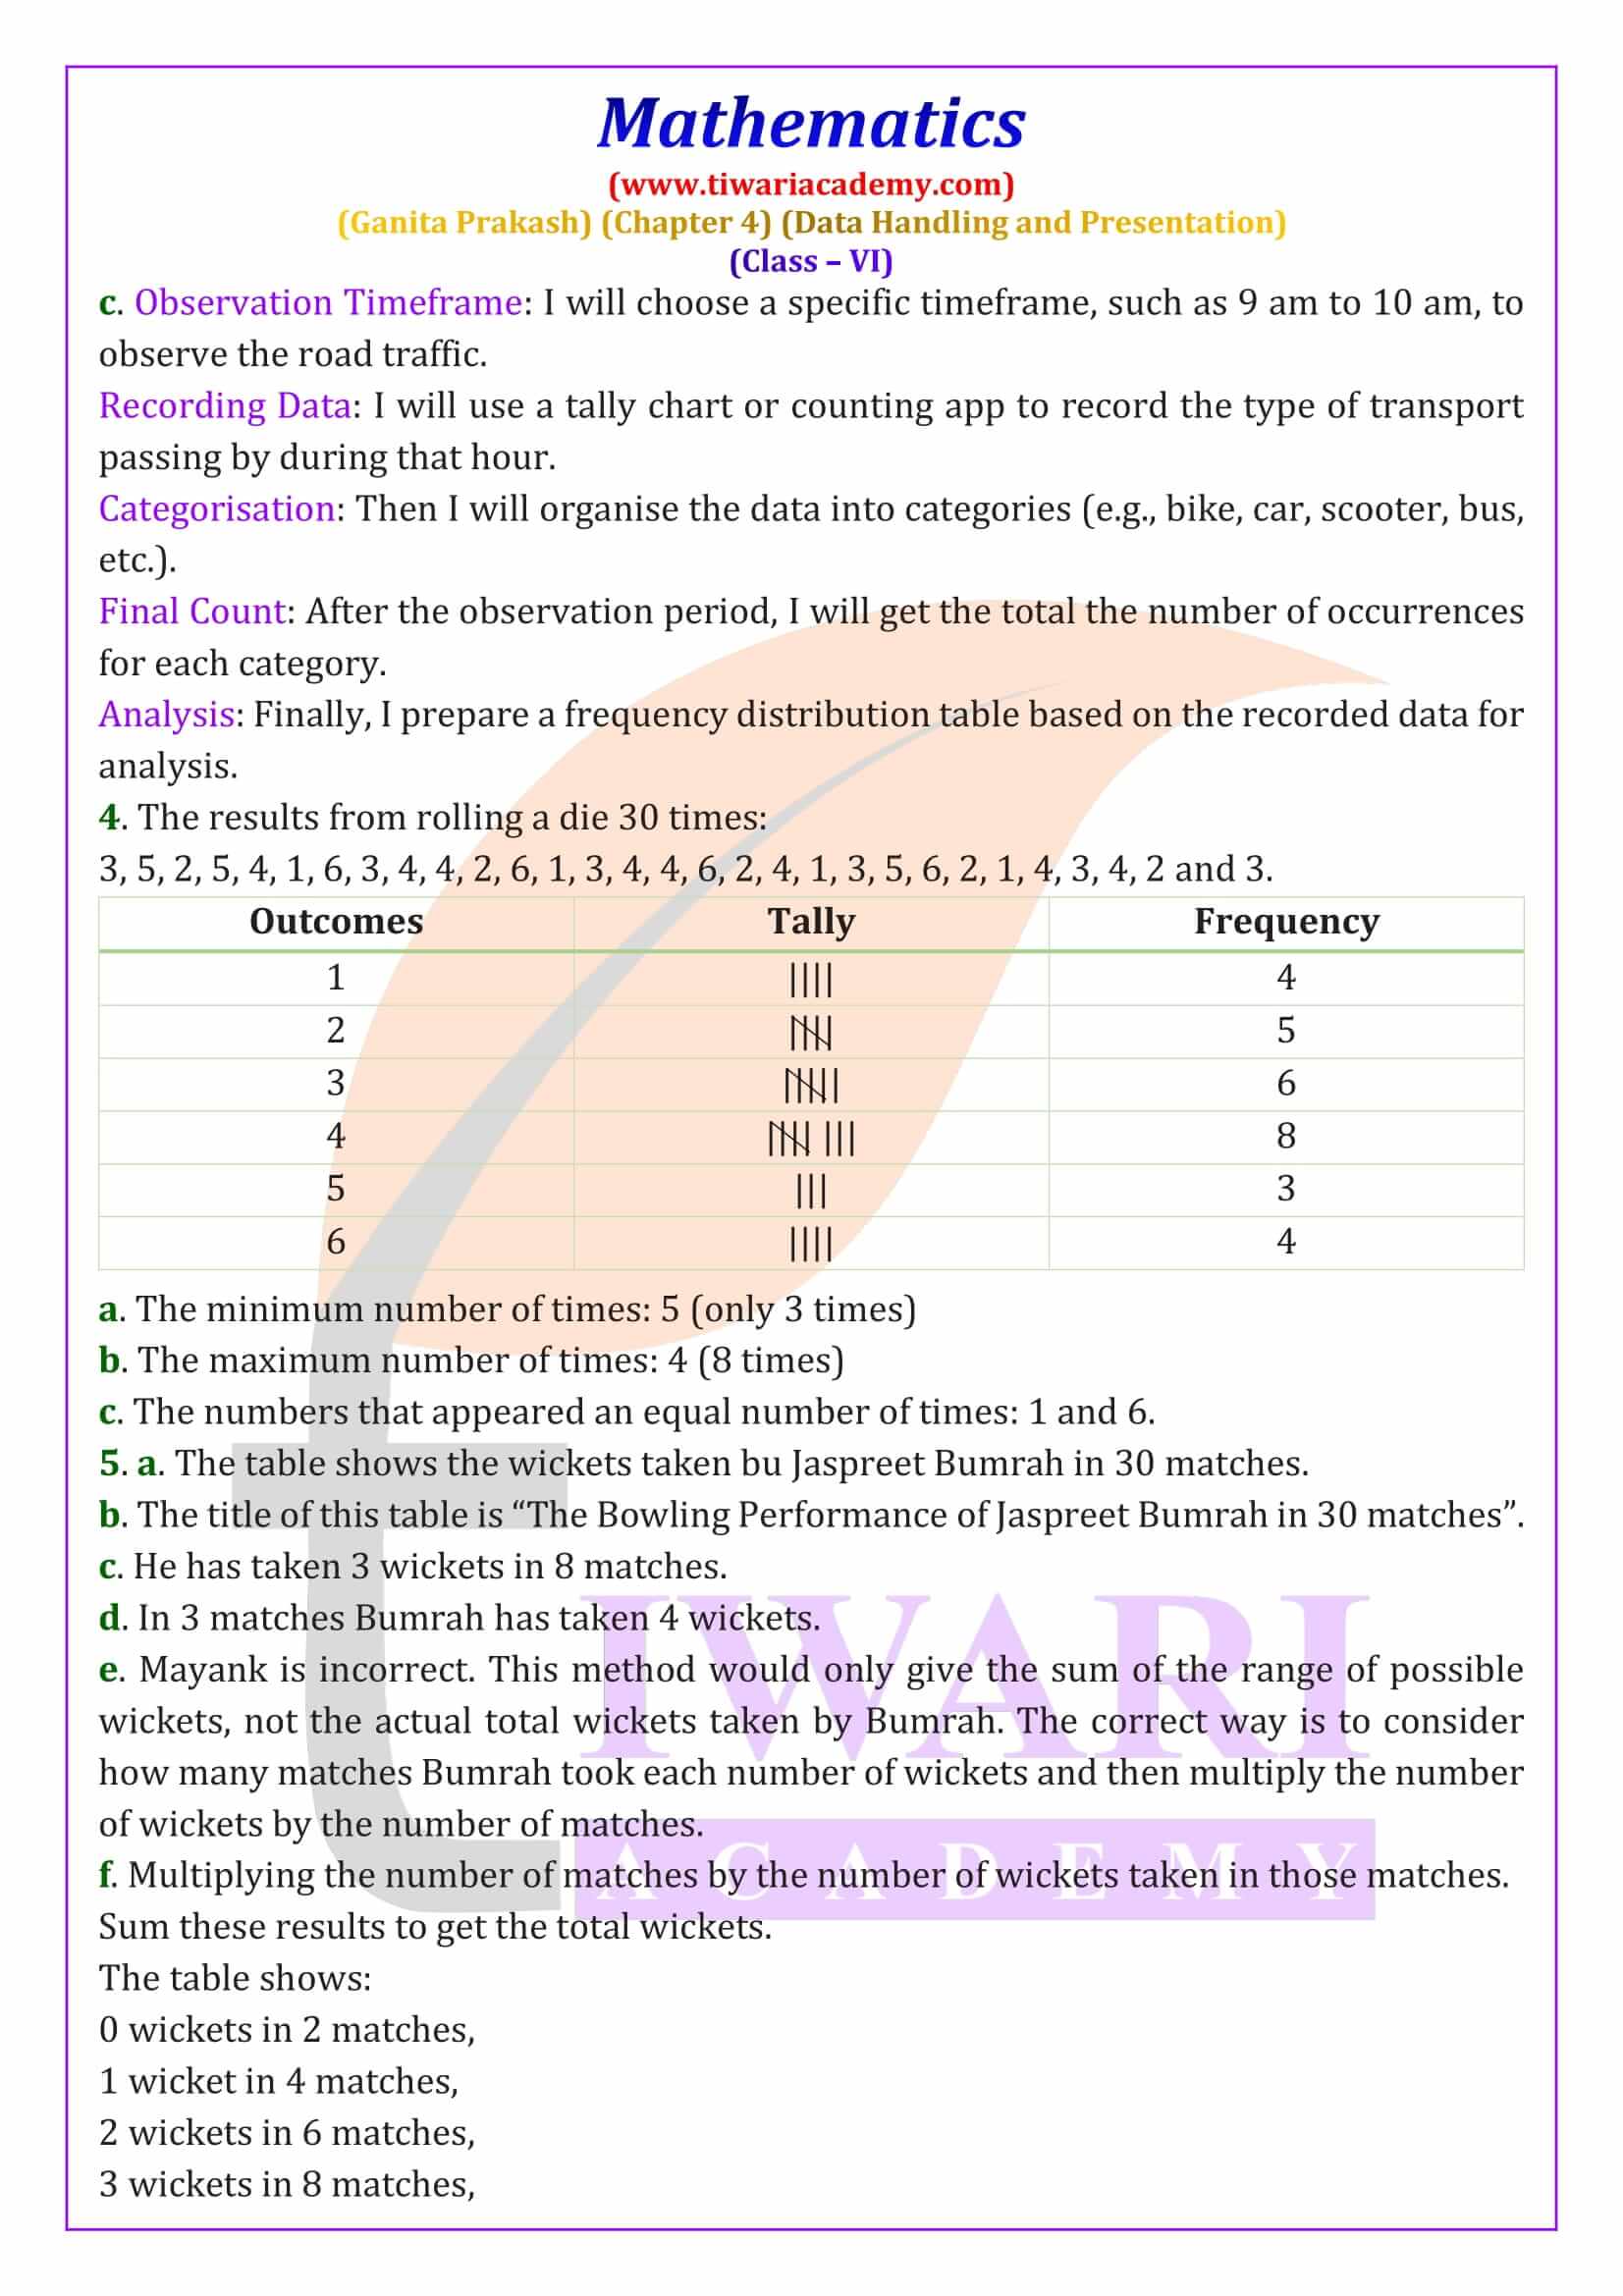
No, Class 6 Maths Ganita Prakash Chapter 4 on Data Handling and Presentation is not considered difficult for most students. It is a practical and engaging chapter because it deals with real-life examples, like favorite games or how many students use different modes of transport to school. The concepts are easy to understand and apply, such as organizing data, using tally marks, pictographs and bar graphs.
However, if students find certain parts challenging, such as choosing the right scale or interpreting graphs, they can always practice more examples. The NCERT solutions available on Tiwari Academy can be a helpful resource to simplify the learning process and clear any doubts.
How much time is needed for an average student to complete class 6 Maths Ganit Prakash Chapter 4?
An average student of class 6 would need around 3 to 4 hours to complete Chapter 4, Data Handling and Presentation. This includes time for understanding the concepts of data, tally marks, pictographs and bar graphs, which might take 1 to 1.5 hours. Additionally, solving exercises and practicing graph drawing could take another 1.5 to 2 hours. Students who use external resources, like Tiwari Academy’s NCERT solutions, finish more quickly as the solutions help simplify the learning process. Overall, the chapter 4 is practical and engaging, so students can grasp the concepts with steady practice and real-life examples.
What is the importance of studying class 6 Maths chapter 4?
Studying Ganit Prakash Chapter 4, Data Handling and Presentation, in Class 6 Maths is important for several reasons:
Understanding Data: This chapter helps students learn how to collect, organise, and interpret data, which is a crucial skill in both academics and daily life.
Practical Application: Students gain the ability to represent data visually through pictographs and bar graphs, making information easier to understand and analyse.
Problem-Solving: It enhances problem-solving skills by teaching students how to make inferences and conclusions based on data.
Real-World Relevance: Data handling is essential in various fields, from science and economics to sports and daily decision-making.
These skills are foundational for higher studies and real-life situations, making this chapter vital.
